


Ever wonder how small numbers can tell a big story about our economy? Think of economic indicators as snapshots of our financial life. They measure things like how much is being made, the prices we pay every day, and how many people are working.
These numbers work a bit like a camera, capturing moments that help us see market trends. In this post, we look at important figures such as Gross Domestic Product (GDP, which is the total value of goods and services produced), the Consumer Price Index (a measure of typical price changes, so you know how much prices rise or fall), and the unemployment rate. Together, these metrics help us figure out if our economy is on the up or facing some rough patches.
Core Economic Metrics: What Economic Indicators Measure
Economic indicators are numbers that help us understand how well our economy is doing. They offer a simple way to see how the economy's overall health improves or declines over time. One key indicator is GDP, which represents the inflation-adjusted total of all final goods and services produced in a country. Think of GDP as a wide-angle snapshot, it’s like counting every item sold in your local market to get a feel for the overall business activity.
Another important metric is the Consumer Price Index (CPI). This measures the price changes of everyday items like food, clothing, and transportation that urban households typically buy. By tracking CPI, we can see how the cost of living shifts over time. Even a small change in prices can make a big difference to household budgets, hinting at larger trends in the economy.
The unemployment rate is another crucial figure. It shows the percentage of people in the labor force who are actively looking for work. Updated monthly alongside other job data, it’s like checking the pulse of the job market. When unemployment is high, it may signal that the economy is under stress, whereas lower rates usually mean more people are working and economic activity is healthier.
Together, these indicators, GDP, CPI, and unemployment, help paint a clear picture of market trends and the overall state of economic performance.
Timing Economic Activity: Leading, Lagging, and Coincident Indicators
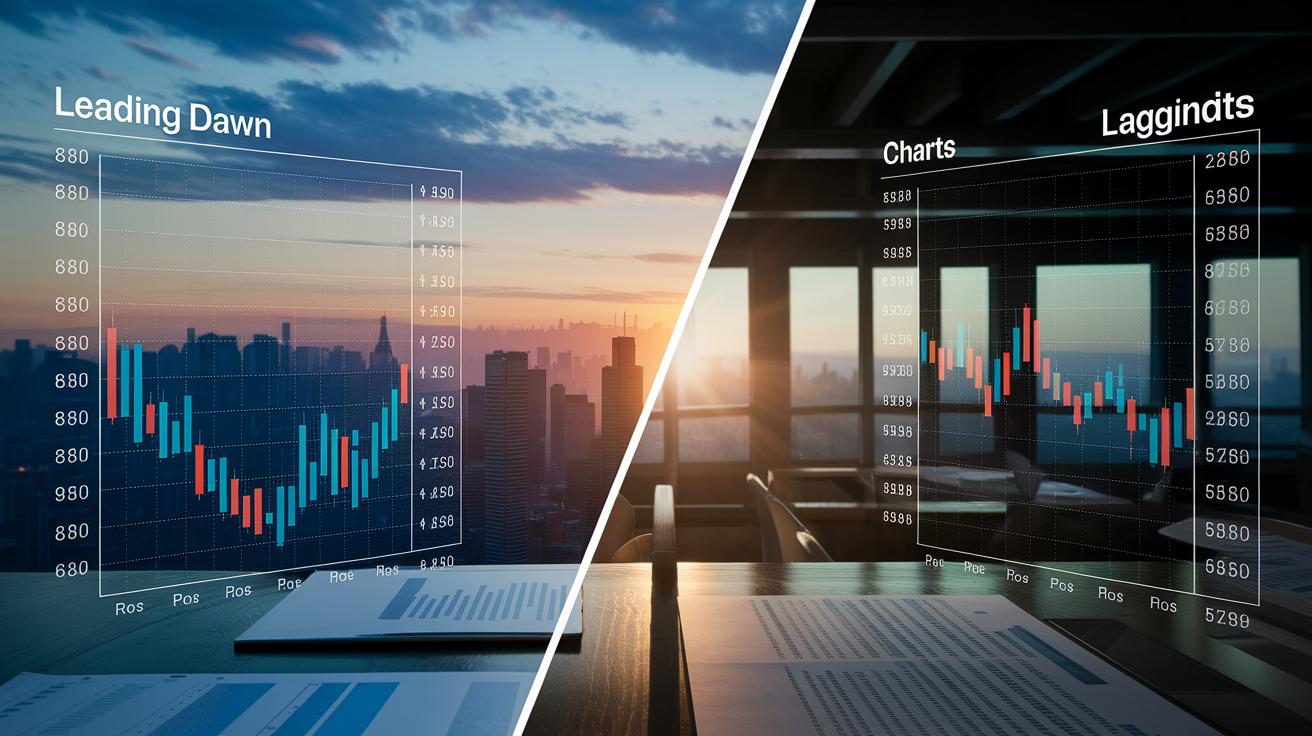
Economic indicators come in different types based on when they reveal information about the market. Leading indicators give us early hints about what could happen next. For instance, changes in consumer confidence or stock market ups and downs can warn us of future shifts in the economy. It is much like noticing the first light of dawn before the full sunrise.
Lagging indicators, on the other hand, confirm trends that have already happened. Numbers such as the unemployment rate, interest rates, or the cost for goods from producers show how past events are affecting us today. Think of it as looking at yesterday's weather to help understand today's conditions.
Coincident indicators show us what is happening right now. Retail sales, new housing projects, and current GDP numbers provide a clear picture of today's economic activity. They help us see which part of the economic cycle we are in, whether it is growing, reaching a peak, slowing down, or bottoming out.
Each category plays an important role in helping analysts, businesses, and policy makers understand our economy and make better decisions.
GDP Indicators: Measuring Total Output and Growth
Imagine checking a country's report card to see how much it makes. GDP does just that, it tells us how much a country produces, adjusted for rising prices. In plain English, it sums up the final goods and services made within a country's borders.
There are two main ways to measure GDP. One way, the expenditure method, adds up everything spent on goods and services. This includes money spent by consumers, businesses, and the government, plus the difference between what a country exports and imports. Think of it like adding up every dollar spent in one busy marketplace to see the full picture.
The other way is the income method. Instead of tracking spending, it totals up all the income earned from production. That means wages, rents, interest, and profits earned from producing goods and services. In other words, it’s like gathering up the earnings of everyone working in that same bustling marketplace.
When GDP goes up, it usually signals that the economy is growing, much like a business making more sales. On the other hand, a drop in GDP might signal a slowdown or hint at a recession.
Economists, analysts, and policymakers look at these changes to understand overall growth and compare performance over time. These important numbers help guide decisions and shape expectations for the future, like looking ahead to 2025.
Inflation Indicators: Tracking Price Stability with CPI and PPI

CPI stands for the Consumer Price Index. Think of it like your usual shopping list with the same items every time you visit the store. When the total price of that list goes up, it shows that living expenses are rising. People who make economic decisions use this measure to see how price changes are affecting everyday budgets and to help decide on interest rate tweaks.
PPI stands for the Producer Price Index. This tool checks the prices domestic companies get for their goods in areas like manufacturing, farming, or mining. Picture it as an early signal. For instance, if the cost of basic materials increases, companies might eventually pass those costs on to you at the store. When CPI numbers steadily rise, it hints at continuing inflation, while steady or lower readings can point to a decrease in prices.
Both CPI and PPI are key when it comes to keeping an eye on price stability and how living costs change. They help experts and decision-makers understand market pressures, so we can see clearer how changes in daily expenses and production costs shape the economy.
Unemployment Indicators: Gauging Labor Market Dynamics
When we talk about the unemployment rate, we mean the number of people actively searching for jobs. Every month, the Bureau of Labor Statistics releases these numbers along with nonfarm payroll data, kind of like checking a neighborhood bulletin board for new opportunities.
The labor force participation rate tells us how many working-age people are in play, whether they’re employed or looking for work. It gives us a glimpse into whether more people want to join the workforce or if they’re stepping away.
Then there’s average hourly earnings and wage growth. Rising wages usually show that workers are making more money, which can boost spending in local communities. On the flip side, if wages remain flat or drop, households might start cutting back, and that can slow down the economy.
When unemployment is high, it often goes hand in hand with fewer jobs and less spending. Tracking these numbers helps us understand the overall health of the labor market and shapes the conversation around economic well-being.
Here are some key points:
- Unemployment tracking
- Labor market trends
- Labor force participation
- Understanding wage growth
Financial Market Indicators: Interest Rates, Money Supply, and Market Trends
Interest rates show what you might pay when borrowing money. When the Federal Reserve changes the Federal Funds Rate, it affects loans and mortgages. When the Fed lowers rates, borrowing becomes cheaper, which can encourage more spending and investment. It’s a bit like adjusting a dimmer switch: turning it up brightens the room.
Measures like M1 and M2 help us see how much money is moving around in the economy. M1 includes the cash you use every day and money in checking accounts. M2 adds savings accounts and small time deposits. This tells us if there is more cash flowing, much like more water in a reservoir leads to a bigger flow downstream.
Market trends are important too. Changes in stock prices and trading volumes can hint at future shifts in the economy. Tools like the VIX, known as the "fear gauge," show how nervous investors are about the market. When the VIX goes up, it might be a signal that a downturn is coming, giving smart investors an early heads up.
By keeping an eye on interest rates and money supply at the same time, we get a clearer picture of how money-related decisions impact our overall economic stability. In short, these financial signs show how government policy and market sentiment work together to shape our financial future.
what do economic indicators measure: Clear Market Trends
Composite and leading indicators give you a quick peek at where the market might be headed. They mix different details to hint at future changes. For example, the Consumer Confidence Index checks how positive people feel about their spending and budgets. When confidence is high, spending can shift, much like the buzz before a local festival gets everyone excited to shop.
Retail sales numbers also offer clues about everyday spending and hint at rising prices. These figures come from monthly data gathered by the U.S. Census. Imagine looking over receipts at your local store to see if more people are buying their essentials.
The Purchasing Managers’ Index, or PMI, tells us how the manufacturing side of the economy is doing. When the PMI is above 50, it means factories are growing. Picture a factory speeding up production because of lots of new orders, a sign that business feels optimistic.
Housing starts and building permits show early signs of changes in the home market. By watching how many new homes begin construction, experts can spot shifts in the housing trend.
Composite indexes like the Conference Board Leading Economic Index bring several data points together into one clear number. This index can even give a warning about a potential recession. Think of it as putting together a puzzle where each piece, from retail sales to consumer mood, helps reveal the full picture of our economic trends.
Final Words
In the action, this piece covered how GDP, CPI, unemployment, and other measures reveal clues about our economy. We broke down the timing of indicators and looked at market signals that help forecast trends. Small, clear steps connect the data points to everyday decisions. All these insights show what do economic indicators measure and how they lead to better financial security and growth. The information we shared can serve as a helpful guide for making smart, confident financial choices.
FAQ
What are economic indicators and what do they measure in business?
Economic indicators are statistical metrics that show the state of an economy. They measure overall output, price trends, and employment levels, helping businesses gauge performance and plan strategies.
What are some examples of economic indicators?
Economic indicators include GDP, CPI, unemployment rates, retail sales, and business confidence indexes. These examples help assess market trends and predict economic shifts.
What are the five key economic indicators?
The five key economic indicators typically include GDP, CPI, unemployment rate, consumer spending, and retail sales. These metrics provide a solid snapshot of economic performance from multiple angles.
What are the three primary economic indicators?
The three primary economic indicators are GDP, CPI, and unemployment rate. They track overall production, price stability, and labor market health, giving insight into a country’s economic condition.
What do economic indicators tell you about an economy?
Economic indicators tell you how an economy is faring by tracking output, price changes, and employment trends. They signal both current conditions and potential future shifts.
What do leading economic indicators do?
Leading economic indicators forecast future economic trends. They include measures like consumer confidence and stock market activity, giving early signals of possible changes before the overall economy shifts.
Why are economic indicators important to a company?
Economic indicators are important because they offer data on market trends and consumer behavior. Companies use this information to manage risks, adjust strategies, and seize growth opportunities.
What are microeconomic indicators?
Microeconomic indicators focus on specific sectors or regions. They look at detailed metrics like local pricing trends and regional employment, helping businesses understand localized economic activity.
How are economic indicators used to measure overall economic health?
Economic indicators such as GDP, CPI, and unemployment rates are used to measure overall economic health. They offer insights into growth, pricing pressures, and labor market conditions, forming a comprehensive performance picture.
What do economic indicators monitor?
Economic indicators monitor growth, consumer spending, price changes, and utilization of labor. They provide essential insights into market strengths and help highlight challenges in the broader economy.