


Have you ever looked at profit numbers and thought they're just digits on a screen? Technical analysis changes that by turning those figures into a clear picture of market trends.
It gathers clues from past price movements and trading volume, which is basically a measure of how easily an asset turns into cash. Traders use these hints to guess what might happen next in the market.
Think of it like checking a map before a road trip, you know which turns bring you closer to your destination. In this post, we'll explore how reading charts and signals can help guide your trading decisions and increase your chances of making a profit.
Comprehensive Overview of Technical Analysis in Financial Markets
Technical analysis looks at past price and volume data to help predict where stocks, currencies, or commodities might go next. The idea is simple: any news or info about an asset is already shown in its price. Over time, traders build their own methods based on personal experience, comfort with risk, and how the markets change. For example, a trader might spot a pattern repeating week after week, almost like watching the same scene play out in a favorite movie.
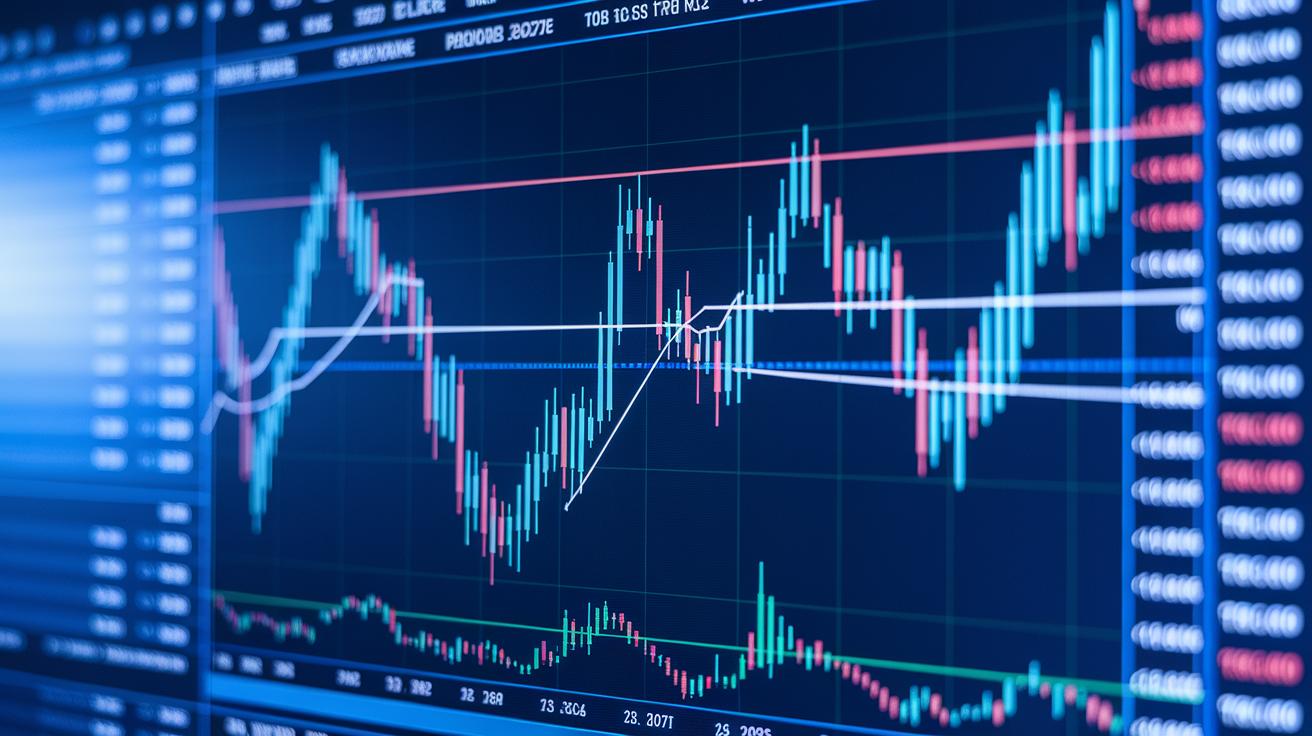
Charts and signals form the core of this method. Traders use tools like line graphs and candlestick charts to capture the market's flow. These visuals show rises, falls, and strong trading days that hint at future movements. Imagine studying a chart where every candlestick shares a little story of market mood, like a tiny hammer formation that might signal a shift in trend, similar to noticing a small sign that your local store is about to change its hours.
A big perk of technical analysis is the quick feedback it offers about market behavior. This helps traders decide the best moments to buy or sell. None of the indicators are foolproof, but when you combine what you see in the charts with volume data, you get a clearer picture of the right time to act. Think of it as checking the market's pulse, where every bit of data adds up to a trustworthy signal for smart trading decisions.
Core Chart Types for Technical Analysis of the Financial Markets

Line Charts
Line charts are a simple way to see trends over a long period. They connect points that show data from different times and help smooth out everyday ups and downs. For example, if you see a smooth rising line over several months, it might mean that a stock’s price is steadily growing.
Bar Charts
Bar charts give you a closer look at daily price changes by showing opening, high, low, and closing numbers. This detail lets you see the full range of a trading day and can help spot short-term shifts. Imagine checking a chart that clearly shows each day’s highs and lows, it makes understanding market moves much easier.
Point & Figure Charts
Point & figure charts cut out extra noise by focusing only on changes in price, not on the passage of time. This style means you only see the moves that really matter, filtering out small, unimportant fluctuations. Picture a chart that marks only the major shifts in price; this clean view can make decision-making feel much simpler.
Drawing Trendlines and Analyzing Support & Resistance in Market Charts
Trendlines are simple lines that connect important low points in a rising market or high points in a falling market. They help you see how prices have moved over time. Imagine drawing a line through several low points in a booming market. If that line suddenly breaks, it might mean the market is about to change direction. One handy tip is to check if the break happens along with a boost in trading volume or a sudden price leap. This gives you a clearer picture of whether prices might keep going in the same direction or start to shift.
Support zones show where prices have bounced up in the past, while resistance levels mark where prices have previously stalled. These levels are key in technical analysis. When a stock pushes past a resistance level and then settles around that area, it often turns into a new support level. Using these ideas together with spot-on trendline techniques can help you catch those early hints of a trend change. In turn, this can guide you on when to enter or exit a trade with a bit more confidence.
Common Pattern Recognition Methods and Price Action Techniques
In trading, technical analysis acts like a friendly guide that helps spot familiar price patterns. It shows clues in candlestick charts and price signals, hinting when a trend might flip or continue.
At its heart, this method involves looking at past price moves to understand current moods. Think of candlestick patterns like snapshots that reveal market sentiment. Patterns such as bullish engulfing, bearish engulfing, hammer, shooting star, morning star, and evening star can signal a change in direction. Meanwhile, patterns like flags, pennants, and rectangles suggest that a trend may take a brief pause before moving ahead. Also, triangles, ascending, descending, or symmetrical, often point to a breakout when prices have settled down.
These techniques help traders decide when to jump in or step out, relying solely on how prices behave. They’re especially handy for short-term moves, letting you act quickly and with assurance. Here’s a quick list of six common candlestick reversal patterns:
- Bullish Engulfing
- Bearish Engulfing
- Hammer
- Shooting Star
- Morning Star
- Evening Star
On top of these candlestick signals, traders use key price action setups to catch early opportunities and weed out false breakouts that might trap them. Essential setups include breakout entries, pullback entries, consolidation breakouts, and false breakout traps. By mixing both candlestick reading and price action strategies, traders can adapt to market changes and boost their chances of success in today’s fast-moving financial world.
Applying Fibonacci Retracement and Market Geometry in Technical Analysis
Fibonacci retracement levels like 38.2% and 61.8% serve as simple markers that help us see the market's momentum. When prices near these numbers, traders keep a close watch to spot any hints of support or resistance that might signal a change. Think of it like a ball that bounces off a soft cushion, it falls, reaches a cushion, and then springs back.
Market geometry uses a straightforward 1:1 measured move to help traders tap into ongoing trends following a correction. This method looks at how far prices typically move and suggests when the current trend could pick up again. It’s a bit like waiting for the perfect moment to jump on a moving train, you need that clear marker to know when it’s safe to get aboard.
Imagine a stock’s price dropping to the 61.8% level and then beginning to rise again. The price bounces up towards a previous high, showing that the retracement level served as a temporary floor and that the market might be ready to continue its trend. Together, these tools offer clues about when the market could resume its momentum after a pause.
Moving Average and Oscillator Indicator Insights for Trading Signals

Moving averages are a trusted way to smooth out price data by taking the average of past prices, which helps remove the short-term ups and downs. Simple moving averages (SMA) and exponential moving averages (EMA) each offer a slightly different view, but they both help clear up the noise. When the short-term average moves above or below the long-term average, it often gives a hint to buy or sell.
Oscillator indicators like RSI and MACD add another layer of insight. They act like speedometers for the market, showing when prices might be too high or too low. In short, these tools track shifts in momentum and can indicate if a market is overbought or oversold. It’s like having a second opinion to back up the signals from the moving averages.
Volume is another key piece of the puzzle. When trading volume picks up, it can confirm the strength of a moving average crossover or the signals from an oscillator. For example, if the RSI shows an overbought condition and there’s a noticeable increase in trading volume, the signal feels much more reliable. This extra confirmation can help guide where to set your entry, exit, and stop-loss points with more confidence.
| Indicator | Signal Criterion |
|---|---|
| SMA Crossover | Short-term moving above long-term |
| EMA Crossover | Short-term moving below long-term |
| RSI Overbought/Oversold | Levels above 70 or below 30 |
| MACD Divergence | Divergence between price and MACD line |
Trading Strategies, Signal Confirmation and Algorithmic Systems in Technical Analysis
Breakout Strategy Techniques
Breakout strategies look for clear chart shapes, like triangles or channels, that act as barriers. When you spot a sharp spike in volume, it can be a cue that the price is really moving. Using extra checks, say, pairing a moving average cross with an RSI filter (RSI tells you if a stock might be overbought or oversold), can help reduce false signals. For example, if a stock breaks upward from a strong resistance level, it might be a good time to buy. Plus, setting a stop-loss just below the most recent low helps protect you from sudden drops. If you're just getting started, you might want to learn more at our day trading for beginners page.
Algorithmic Signal Systems
Algorithmic systems use computer rules to find trading signals and then make trades automatically. They test rules on past data to make sure the conditions are right before jumping in. This method takes emotion out of the mix and makes decision-making faster. When several indicators back up a signal, you have a better chance of avoiding false moves. And since the system handles routine checks, you can keep your eyes on the bigger picture of the market. This blend of clear rules and computer precision helps you stay disciplined, which is key when every moment matters.
Risk Management Techniques and Confirmation Strategies in Technical Analysis

When you're diving into technical analysis, it's important to see risks clearly and be ready to act fast. No one tool works in every situation, so savvy traders often use stop-loss orders set just below recent swing lows or near moving average supports. They also keep track of position sizing and risk-reward ratios, which help decide how much to risk on each trade while keeping any potential losses small compared to the possible gains. Many traders even follow a personal playbook that includes these safety steps, using trusted guides like this article on risk management techniques to steer them in the right direction.
Before jumping into a trade, it's smart to get a bit more validation. Most experienced traders wait to see at least two signals, whether coming from moving averages or momentum oscillators, coming together before they act. This extra check helps filter out false signals and confirms that market trends and price moves are on point. Using several tools to back up a decision not only makes for a more well-rounded strategy but also helps keep emotions at bay when the market speeds up. In quick-moving markets, those built-in checks make it easier to stick to a clear, balanced approach to managing risk.
Final Words
In the action, we've explored key chart types, trendlines, support and resistance, and the vital role of patterns and Fibonacci retracements. We looked into moving averages, risk management, and confirming signals before trading. These insights form a practical guide rooted in technical analysis of the financial markets. The ideas shared aim to give you the confidence to use time-tested tools and approaches for a secure financial future. Keep learning, stay curious, and trust your strategy.
FAQ
Q: Where can I find Technical Analysis of the Financial Markets by John J Murphy in PDF or Ebook format?
A: The inquiry targets access to John J Murphy’s book, which is offered in PDF, Ebook, and printed editions. Legitimate sources provide these formats, so check reputable retailers and libraries to obtain a quality copy.
Q: What is technical analysis of the financial markets?
A: The definition of technical analysis of the financial markets is using past price and volume data to forecast future price trends. It assumes that the asset’s price reflects all current market information.
Q: Is technical analysis of the financial markets still relevant?
A: The question about relevance shows that technical analysis remains useful for spotting trends and key price levels. Many traders depend on charts and indicators as one of several tools to guide their market entries.
Q: What does Warren Buffett say about technical analysis?
A: The question regarding Warren Buffett indicates he prefers fundamental analysis over technical charts. Buffett’s focus is on a company’s true value rather than patterns found in market price movements.
Q: What is the 50% rule in trading?
A: The explanation of the 50% rule in trading is that a price frequently retraces around half of its prior movement before resuming its trend. Traders use this rule to identify potential support or resistance levels.
Q: What books and resources are recommended for learning technical analysis and trading psychology?
A: The recommendation highlights books like Technical Analysis Explained, Trading in the Zone, Market Wizards, and Reminiscences of a Stock Operator. These resources offer practical insights on chart reading, strategies, and trader psychology.
Q: What techniques are used in Japanese candlestick charting?
A: The description of Japanese candlestick charting techniques shows they use visual patterns to signal market trends and reversals. This method helps traders quickly recognize bullish or bearish signals solely from price action.