

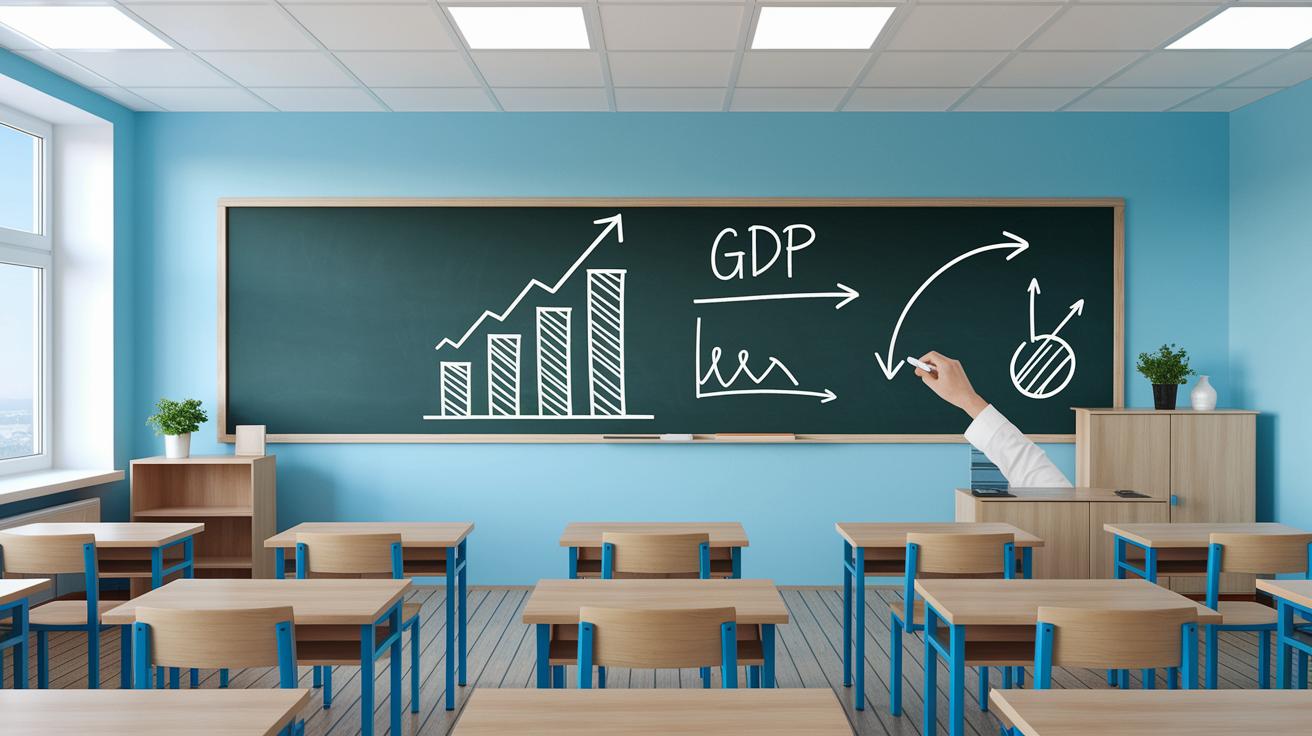

Ever wonder how you can tell if a country's economy is really booming? Imagine watching a bakery grow, making more bread and treats every day. In this post, we'll talk about simple numbers like GDP (which measures all the goods and services a country makes) and other useful figures that show growth in production and jobs. We'll break these signs down in clear, everyday language so you can see what drives a strong economy.
Measuring Economic Growth: Key Indicators and Approaches
Economic growth shows us how much more a country can produce over time. The most common way to measure this is by using GDP, which stands for gross domestic product. Imagine a bakery: if it makes more bread each day, it's a sign that things are improving. When a country produces more goods and services, it sends a clear signal that its economy is doing well, a key insight for both policymakers and investors.
There are several ways to check on this progress. First, there’s GDP, which tells us the total value of everything made within a country. Then there’s GNP (gross national product), which includes money earned from overseas investments but takes out earnings by foreigners within the country. We also look at productivity levels. This shows how effectively workers and machines work together without needing extra resources. And finally, employment rates help us understand how well jobs are growing, especially in sectors that drive the economy forward.
- GDP: The total value of all finished goods and services produced in a country.
- GNP: GDP plus net income from overseas investments, minus what foreigners earn within the country.
- Productivity levels: A measure of how efficiently labor and equipment combine to produce output.
- Employment rates: Key indicators of job creation that highlight the health of the economy.
Each of these measures gives us a different look at how strong the economy really is. Together, they form a full picture of both the output and the underlying strength in how the economy uses its people and machines.
Gross Domestic Product: Core Measurement for Economic Growth

GDP is the main number people look at when they want to know how a country's economy is doing. In simple words, GDP is the total value of all finished goods and services that a country produces in a set time. Think of it as a snapshot of how busy a nation’s economy is. Experts use GDP to watch if the economy is growing or slowing down. But there’s more to it than just one number. You have to dig into how it's measured to see things like inflation (which means rising prices) and price changes over time.
There are two common ways to measure GDP. Real GDP is adjusted for inflation, so it shows the true output by using prices from a past year as a base. Nominal GDP, on the other hand, shows numbers at today’s prices without adjusting for inflation. That way, comparing the two tells us if a rise in GDP is due to more products and services or just higher prices.
Another tool is the GDP deflator, which checks the overall change in prices for everything produced in the country. It compares the nominal GDP with the real GDP, giving a clear mix of inflation effects and actual production growth.
| Measure | Definition | Example |
|---|---|---|
| Real GDP | Output adjusted for inflation using constant prices | Reviewing numbers over the years with prices from a fixed base year |
| Nominal GDP | Output measured at current market prices | Looking at this year’s production without any adjustments |
| GDP Deflator | A measure that reflects price changes for all goods and services produced | Comparing the nominal figure to the real one to gauge inflation |
When you examine these figures together, you get a much clearer picture of the economy. It’s not just about whether GDP is up or down, but also why it is. Are we really producing more, or are prices just higher? This deeper look helps us understand how strong or weak an economy really is.
Beyond GDP: GNP and Income per Capita in Growth Measurement
GNP is like GDP but with a few extra steps. It adds the money our residents earn from investments abroad and takes away what foreigners earn here. This gives a clearer picture of the overall income available to our people, including the benefits of international money flows.
GDP per capita, on the other hand, simply divides the total GDP by the number of people. It’s a handy way to compare how different countries perform. But if a country has a lot of retirees, the number might not tell the whole story because not everyone is earning. In other words, GDP per capita can sometimes hide the true picture of economic strength for those actively working.
Some experts fine-tune these numbers by looking only at the working-age group instead of everyone. For example, studies in Wisconsin from 1970 to 2023 showed that growth amounted to about $1,022.20 per working-age person rather than just $646.16 per resident. Adjusting the figures this way makes it easier to see how changes in the population can affect the overall health of the economy.
Productivity Metrics: Evaluating Efficiency in Economic Growth
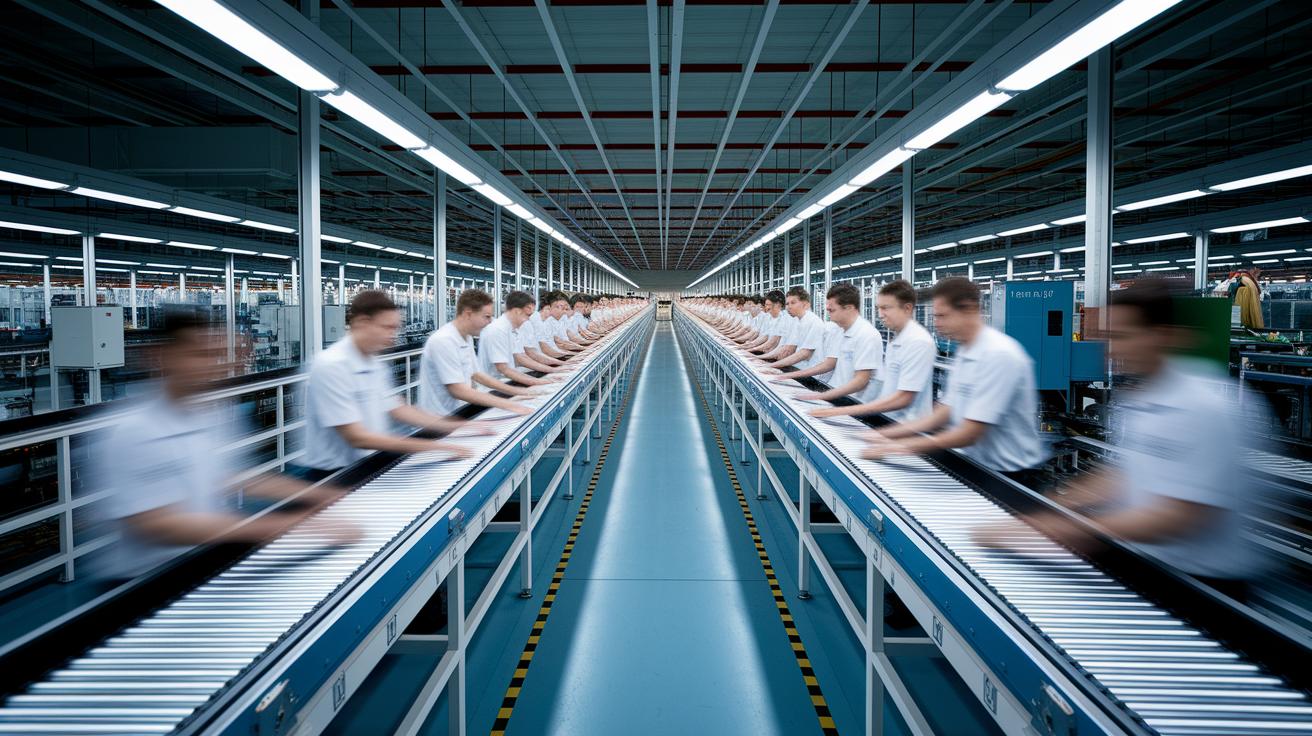
Productivity is a simple way to check how well an economy uses its resources. It shows how workers and equipment team up to make goods and services. When productivity goes up, it means more is being made with the same or even fewer inputs. Think of a factory line where the team finds a smoother method to make extra units, this smart use of resources sets the stage for steady, long-term growth.
Labor productivity tells us how much output each worker or each hour can produce, while capital productivity looks at how much result comes from every unit of investment like machines or tools. These numbers help experts find areas where things can run smoother and resources can be saved. When both types of productivity improve, it’s a strong sign that the economy is making better use of its people and resources. Keeping an eye on these measures gives a clear view of how well the economy is doing and guides smart choices for boosting efficiency and growth.
Challenges and Advanced Models in Growth Measurement
GDP and GNP numbers alone often don't tell the whole story about economic growth. Changes in the population, the size of the underground economy, and shifts in prices can easily skew these figures. When comparing real numbers to nominal ones, it can hide important inner changes or inflation effects, making it hard to see what's really happening. It might even seem like focusing on these big numbers leaves out the subtle details of how the economy is doing.
To tackle these problems, experts now use more advanced approaches. They use tools like input-output tables and econometric simulations to see how different parts of the economy are connected. In simple terms, these methods help show how a change in one area can create ripples throughout the whole system. They catch those tricky details that traditional measures might miss.
Looking at long-term and sustainable growth means we also have to think about things like how income is spread out, activities that don't happen in regular markets, and the impact on our environment. This wider view helps catch those small shifts that usual measures leave out, giving a truer picture of steady, solid growth.
Final Words
In the action, we broke down key indicators of growth and explained vital approaches like GDP, GNP, productivity, and employment rates. The post showed how these measures work together to give us insight into economic performance and how is economic growth measured in practice. It also highlighted how advanced models address traditional metrics' limits. Each method adds a layer of clarity, making it easier to see how economies strengthen and evolve, leaving us with a positive view of future financial progress.
FAQ
What is economic growth?
Economic growth means a rise in producing goods and services over time, typically measured by GDP. It indicates a stronger economy that can benefit businesses and create jobs.
Why is economic growth important?
Economic growth matters because it boosts a country’s capacity to produce, helps create jobs, and improves living standards, making the overall economy healthier and more resilient.
How is economic growth measured in America and most commonly?
Economic growth in America is measured primarily through GDP, especially real GDP which adjusts for inflation, along with nominal GDP that uses current prices for a full economic picture.
What are the two main measures and calculations for economic growth?
Economic growth is tracked by examining percentage changes in GDP figures and comparing nominal with real GDP, methods that show overall output shifts and adjust for inflation.
What are the four factors of economic growth?
Four factors include GDP, GNP, productivity levels, and employment rates; each of these indicators reflects aspects of production volume, income, efficiency, and job creation in the economy.
What is economic development and how is it measured?
Economic development is a broader idea that looks at improving living standards and wealth distribution. It is measured using metrics like per capita income and various quality-of-life indicators.
What economic growth example can illustrate these concepts?
A clear example is a country where rising GDP aligns with higher employment and productivity, demonstrating how increased production and job growth signal a healthy, expanding economy.