



Ever wonder how one simple math trick can show a country’s financial heartbeat? In this post, we explain easy ways to track growth. For example, you can look at quick changes in GDP (that’s gross domestic product, which tells you the total value of goods and services in a country) and gains per person. Even a small change in these numbers might hint at big shifts in the economy. Keep reading to see how these formulas reveal the real forces behind market trends.
economic growth rate calculation: Simple Clear Formulas
When you want to check how an economy is doing, choosing the right formula makes a big difference. A good formula helps you see what each part means and shows how different factors play a role. It also lets you spot trends and changes over time, so you can make smart decisions.
For example, think of GDPt as the economy's output right now and GDPt-1 as the output from the previous period. This comparison shows you how the economy grows each year. One surprising fact is that a country once saw its annual growth jump over 5% just by boosting net investments in machinery!
| Formula Name | Equation | Variables Explained |
|---|---|---|
| Annual Growth Rate | ((GDPt – GDPt-1) / GDPt-1) × 100 | GDPt: current output, GDPt-1: previous output |
| Compound Annual Growth Rate | ((GDPt / GDP0)^(1/n) – 1) × 100 | GDP0: initial output, GDPt: current output, n: number of years |
| Per Capita Growth Rate | ((GDPpct – GDPpct-1) / GDPpct-1) × 100 | GDPpct: output per person now, GDPpct-1: output per person before |
Which formula you use depends on the growth you want to study. If you're looking at short-term changes, the annual growth rate is great because it directly compares two periods. For an average growth over a number of years, the compound annual growth rate is the best pick. And if you want to see how well people are doing alongside the economy, then the per capita growth rate is the answer.
Each formula sheds light on a different part of economic growth, and knowing what the numbers mean helps you choose the one that fits your analysis best.
Comparing Nominal and Real Economic Growth Rates
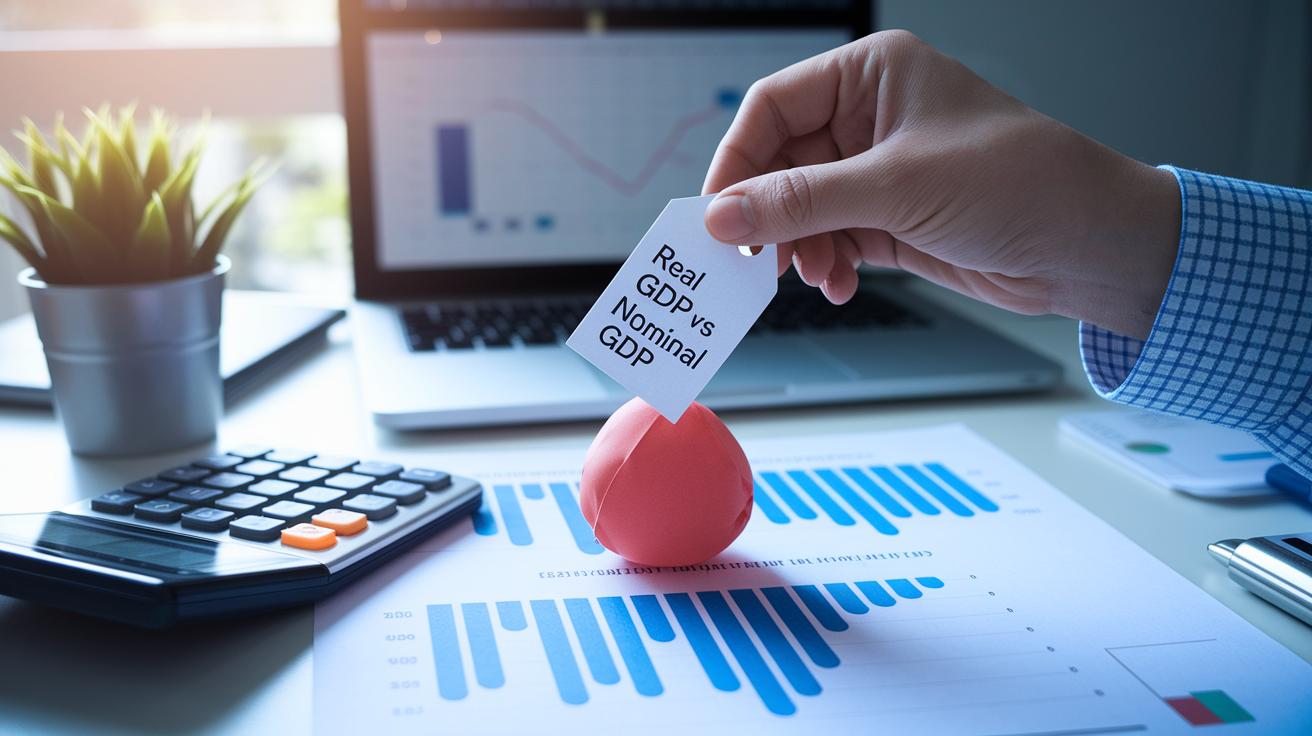
Raw price changes can hide what’s truly happening in the economy because they mix in the effects of inflation. When we only look at nominal GDP – which uses current prices – it might seem like the economy is growing, but part of that rise could just be due to higher prices. Think about it like counting your dollars without checking if each one actually buys less than it used to. This mix-up makes it tough to tell if the economy is really expanding or just showing price increases.
The GDP deflator helps clear things up. It is found by dividing nominal GDP by real GDP and then multiplying by 100. Real GDP uses prices from a fixed base year so you can see changes in the amount of goods and services produced instead of just price changes. This approach shows the real growth in output, helping to reveal whether the economy is growing because of more production or just higher prices.
Many decision-makers rely on real GDP because it gives a steady measure over time. This consistent view makes it easier to plan and set long-term economic strategies.
Step-by-Step Manual Computation of Annual Growth Rate with Example
When you calculate annual growth by hand, it's easy to slip up if you use the wrong numbers or mix up the time frames. Always pull GDP figures from trusted sources and make sure both current and previous figures cover the same period.
Start by subtracting last year's GDP from this year's. Then, divide the difference by last year's number. Multiply by 100 to turn it into a percentage. On a fun note, did you know that before she became a famous scientist, Marie Curie once carried test tubes with radioactive material in her pockets? Clarity in each step helps you avoid small mistakes that could change your final answer.
For example, if GDP grows from $1.5 trillion to $1.58 trillion in one year, you subtract 1.5 from 1.58, then divide by 1.5, and finally multiply by 100. This gives an annual growth rate of about 5.33%. A common mistake is switching the order of subtraction, which might show a negative growth rate even when the economy is doing well.
When looking at growth over several years, the compound annual growth rate (CAGR) smooths out the ups and downs. For instance, if GDP climbs from $1 trillion in 2018 to $1.2 trillion in 2021, use this formula: ((GDP at the end / GDP at the start)^(1 divided by the number of years) – 1) multiplied by 100. For these numbers, ((1.2 / 1)^(1/3) – 1) times 100 gives an average annual growth of about 6.2%. Make sure to count the years correctly, as one extra or one less can throw off your calculation.
| Mistake | Tip |
|---|---|
| Using GDP numbers from different periods | Always double-check that both figures come from the same time frame. |
| Rounding early during calculations | Keep extra decimals until the final step to avoid inaccuracies. |
| Miscounting the number of years for CAGR | Confirm the exact number of periods before using the formula. |
Leveraging Excel and Spreadsheets for Economic Growth Rate Calculation

Spreadsheets make it simple to calculate economic growth fast and accurately. In Excel, you can type a handy formula like =(B2-B1)/B1*100 in a new column. This easy formula shows you the percent change between two periods right away, helping you see how numbers change over time. Just type this into cell C2 to check last year’s growth.
To keep your data neat and cut down on mistakes, try naming the ranges for your key numbers. For example, call your starting values "BaseYear" and your target values "TargetYear." This lets Excel quickly find the right numbers in your formulas. Adding data validation rules also makes sure every entry uses the correct period and year.
If you want to look at trends over several years, set up a compound annual growth rate, or CAGR. You can use the formula =((B4/B1)^(1/(4-1))-1)*100 to figure out the average yearly growth. This method smooths out the yearly ups and downs, giving you a clear picture of overall performance, kind of like assembling a report card that shows steady progress.
To really bring your data to life, use Excel line charts or sparklines to see your growth trends. These visuals let you spot patterns quickly so you can understand the numbers at a glance.
Plus, there are plenty of free downloadable templates and online calculators out there. They can help automate per-capita and multi-year analyses, making it even easier to set up and monitor your numbers with little hassle.
Advanced Statistical Modeling Techniques for Growth Rate Estimation
Time-series regression helps us understand how factors like labor, capital, and technology drive changes in GDP. By studying past economic data, analysts can break down the role each element plays in boosting growth. For example, this method clearly shows the steady impact of technological changes on production levels.
Models such as ARIMA and VAR add even more insight. ARIMA looks at trends and patterns over time, while VAR examines several variables at once to capture sudden shifts or shocks in GDP. In simple terms, these models use past data patterns to hint at what might happen in the future. If you're curious to learn more, you can explore advanced quantitative analysis methods online. Plus, Monte Carlo simulations allow us to run many scenarios to see how different economic conditions might affect forecast outcomes.
Growth-accounting decomposition is another helpful technique. It breaks down changes in output into parts, such as the shares coming from labor, capital, and overall productivity (how efficiently resources are used). This method makes it easier to see what drives long-term growth versus short-term ups and downs, painting a clearer picture of the economic landscape.
Good quality data is key to solid analysis. When direct estimates aren't available, analysts often use potential-GDP estimates derived from total-factor productivity (TFP) residuals. Many common software tools come with built-in features for time-series regression, ARIMA, and VAR modeling as well as simulation tools. This accessibility means that even more complex models can be put to use by practitioners without a steep learning curve.
Analyzing Growth Rate Trends and Forecasting Economic Expansion
Rolling averages are like a smoothing brush for data. They take a bunch of numbers over a set time, average them out, and filter the random ups and downs, so you see the bigger picture. For instance, when researchers averaged five years of quarterly information, those sudden dips disappeared, revealing a steady upward trend that changed the whole story on growth. This method makes it easier to plan ahead by showing the true trend.
Leading indicators, like industrial output and retail sales, work as early hints of changes in the economy. They often alert us to shifts before the effects hit hard. For example, when retail sales steadily climb, it might signal a broader market improvement, giving analysts a chance to tweak their strategies in time.
Forecasting models, such as exponential smoothing or ARIMA-based methods, use past data to sketch out future growth paths. Think of these models as tools that help predict what's coming next, similar to the projections you might see in an economic outlook for 2025. They take history and turn it into a clearer forecast.
Line charts and sparklines add visual clarity by highlighting different phases and turning points in the cycle. These visuals allow decision-makers to quickly wrap their heads around what the data is really saying and share complex trends in a simple way.
Final Words
In the action, we explored formulas for annual, compound, and per capita rates, compared nominal and real GDP measures, and walked through steps from manual math to Excel setups. The guide touched on advanced statistical models and how to visualize trends for forecasting future growth. Each section offered clear, simple examples to show how economic growth rate calculation plays a role in day-to-day financial decisions. The insights here leave us feeling confident about spotting market trends and building a secure financial future.
FAQ
How do I use an economic growth rate calculator?
The economic growth rate calculator simplifies the process by taking current and previous GDP values and computing the annual growth rate using the formula ((GDPₜ – GDPₜ₋₁)/GDPₜ₋₁)×100.
Where can I find economic growth rate calculation formulas and related PDFs?
The economic growth rate calculation PDFs provide detailed formulas—such as annual, compound, and per capita growth rate formulas—helping users follow clear steps to compute economic growth accurately.
What is the formula for calculating real GDP growth rate?
The formula for calculating real GDP growth rate is ((GDPₜ – GDPₜ₋₁)/GDPₜ₋₁)×100, using constant prices to exclude inflation effects and reflect true changes in economic output.
What is the nominal GDP growth rate formula?
The nominal GDP growth rate formula is calculated as ((Nominal GDPₜ – Nominal GDPₜ₋₁)/Nominal GDPₜ₋₁)×100, capturing both changes in production volume and price increases in the economy.
How do you calculate the overall economic growth rate?
The overall economic growth rate is computed using ((GDPₜ – GDPₜ₋₁)/GDPₜ₋₁)×100, which measures the percentage increase in total economic output between two consecutive periods.
What are the three formulas used for calculating GDP growth?
The three formulas include the annual growth rate, the compound annual growth rate (CAGR) for multi-year analysis, and the per capita growth rate, which adjusts GDP changes by population growth.
What is the formula for calculating the growth rate of GDP per capita?
The formula for GDP per capita growth is ((GDPpcₜ – GDPpcₜ₋₁)/GDPpcₜ₋₁)×100, measuring the percentage change in economic output per person over consecutive periods.