


Have you noticed falling prices lately and wondered if they mean trouble or a sign of hidden strength? Recently, agricultural products have surprised many. Even when prices for food, raw materials, and drinks dipped, the market still felt upbeat.
Shifting costs and wild weather are driving prices higher again. This article takes a closer look at these trends and shows how a bit of optimism can help the market bounce back even when things seem to slip.
Comprehensive Agricultural Commodity Price Trends
Agricultural commodities are basic building blocks for food and other production needs, like wheat and coffee. The World Bank’s agricultural price index gives us a clear look at how these key items are doing. In Q2 2025, the index dropped by almost 7 percent. Food prices fell by 7 percent, raw materials slipped by 1 percent, and beverage prices tumbled by 13 percent. This snapshot helps us see how prices move over time and compare today's produce values with past trends.
| Period | Price Movement |
|---|---|
| 2023 | Baseline levels |
| 2024 | Moderate changes |
| Q2 2025 | Down nearly 7% (Food -7%, Raw Materials -1%, Beverages -13%) |
This significant drop in Q2 2025 shows how several market factors affect these prices. Higher input costs and changes in supply and demand are some of the reasons behind this fall. Experts think these forces might keep pushing the index lower as they respond to broader economic trends. Basically, shifts in the economy and market mood directly affect how these prices move.
Over the years, while prices for agricultural products have sometimes stayed steady, they also change quickly due to weather, government rules, and energy costs. Both short-term and long-term factors hint that this downward trend might last into 2025 and 2026. This insight helps us understand how market trends and historical yield prices can shape future talks about agriculture and food supply.
Key Factors Shaping Agricultural Commodity Prices
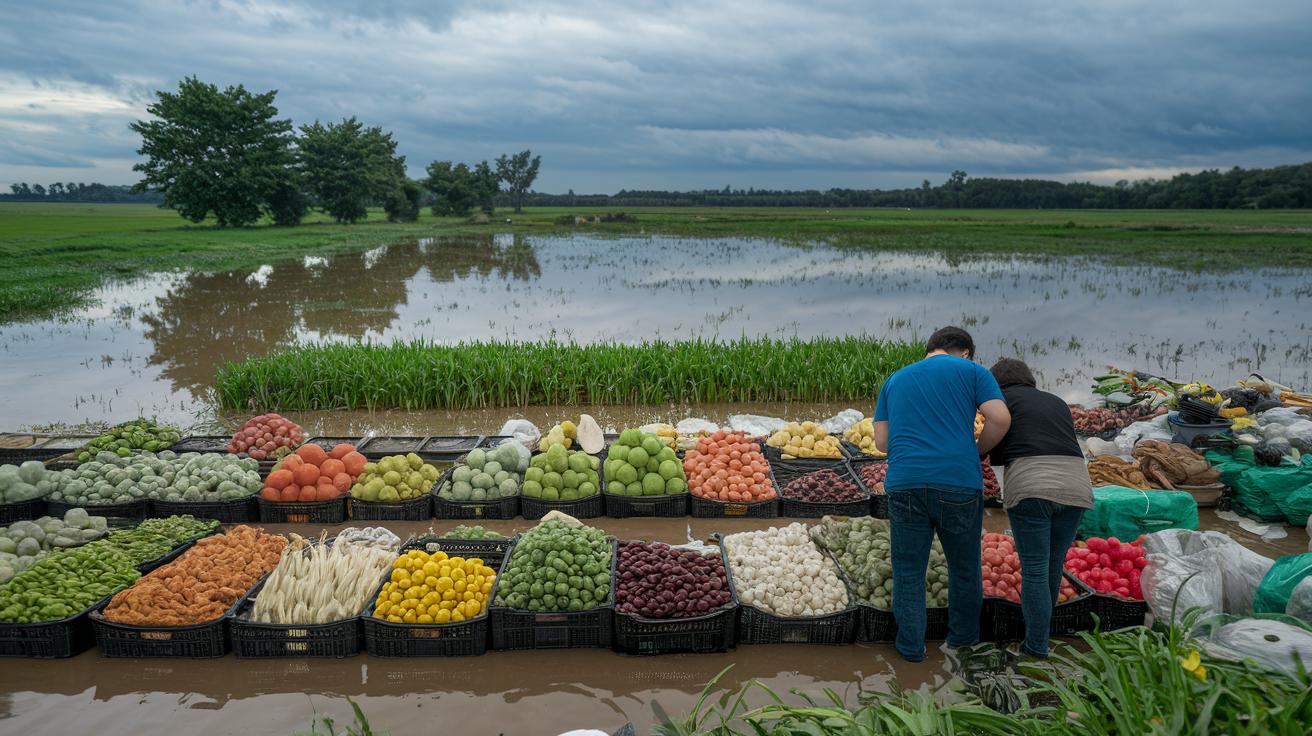
Extreme weather like drought, floods, and hurricanes can quickly lower crop yields. For example, a heavy flood might wipe out a whole season’s harvest, leaving fewer goods on the market and pushing prices higher. Such weather surprises cause prices to move fast and by a lot.
Global supply and demand also play a big part. When there’s too much supply, prices drop quickly. But when there isn’t enough, prices rise just as fast. It’s like a seesaw, an unexpected extra crop can drop prices, and a sudden shortage can push them back up.
- Policy changes, such as tweaks to tariffs, subsidies, or quotas, can shake up the market.
- Rising input costs, like higher prices for fertilizer, fuel, and pesticides because of increased energy costs, can bump up prices.
- Growing biofuel demand often shifts food crops into energy production, reducing the supply available for eating.
Often, these factors mix together. For instance, harsh weather might force governments to change policies, which can add pressure on input costs or push more crops toward biofuel use. This mix keeps the market lively and makes commodity prices hard to predict, yet also brings a bit of excitement to the scene.
Regional Variations in Agricultural Commodity Prices
In North America, the US market is often set by corn and soy. These crops drive export activity and get updated regularly by USDA reports. In Canada, crop values depend on both the quality of the harvest and how well goods move by rail. This means the market mostly follows the usual ups and downs of supply and demand.
Down in Oceania, Australia puts its focus on wheat and barley. Most of these exports head to Asia, and farmers often tweak their production plans when new selling opportunities arrive. Seasonal weather changes and emerging nearby buyers also play a big role in how prices shift.
In parts of Sub-Saharan and South Asia, like Kenya and Pakistan, you can see sharp price increases. Local shortages and higher costs for imports push prices upward. At the same time, there’s growing demand for vegetable oils, pulses, and dairy products, thanks to strengthening local economies.
Across Europe, particularly in Britain, farm indicators show clear reactions to changes in EU trade rules and overall market mood. These indicators serve as useful guides for farmers and experts, highlighting how shifts in local production costs and output might affect future price trends.
agricultural commodity prices Soaring with Market Optimism

Even though things look bright out there, short-term forecasts are saying that prices for key crops might drop a bit soon. Experts use simple models that mix weather forecasts and crop yields to predict that by the end of 2025, rising input costs could push prices lower. Think of it like checking your savings account before a deposit, you might see a little gap even when the future looks promising.
Right now, grain futures show that near-term prices are higher than the ones set for later. This tells us that traders expect a small squeeze soon because supply is a bit delayed, but they also think things will ease up a little over time.
For both farmers and investors, these hints mean there could be smart opportunities. Even if prices fall a bit at first, adjusting your position may lead to some real value. Keeping an eye on the futures curve and the weather is a bit like reading a map, helping you navigate the twists of the market.
Looking further ahead, long-term models include things like climate trends and rules on biofuels (biofuel mandates require a certain amount of crops to be used for fuel). These clues suggest that in 2026, the World Bank index might stay low because of high input costs and shifting global demand. In simple terms, stricter biofuel rules might take some crops away from food, tightening the supply. It’s a bit like planning an outdoor event with unpredictable weather, you adjust your plans as the conditions change.
Analyzing Agricultural Commodity Price Volatility
Sometimes, traders bet in commodity futures in a way that causes prices to jump or dip more than you’d expect from supply and demand alone. Even if these short-term moves look wild, the long-term trend always comes back to how much is produced and how much people need. Think of it like a seesaw: a quick push might tilt things briefly, but in the end, real production and consumption bring balance.
Big shocks over the short term often happen because of changes in the economy, trade problems, political issues, or even severe weather. Imagine planning a picnic and then suddenly getting caught in a downpour. When a key farming region faces a bad storm or intense unrest, prices can change fast, just like a sudden wind can alter a sailboat’s path.
Investors use a mix of strategies to keep things steady. They might use futures hedges, options (contracts that give you a right to buy or sell at a stated price), or real-time trading tools to check the market pulse. They also set up stop-loss orders as safety nets against drastic drops. One trader put it simply: "I check my plan, just like you’d review your homework before a test." This careful approach helps them manage the ups and downs as they happen.
Tools and Techniques for Tracking Agricultural Commodity Prices

Traders and analysts often start with basic data from the World Bank's agricultural price index and USDA report releases. These trusted sources give a clear look at today's prices and past trends, setting the stage for thoughtful market analysis. Real-time data feeds from exchanges add extra support by showing live trading charts. Imagine checking your mobile app and watching the numbers update instantly, much like seeing a sports score change as the game unfolds.
Free charting platforms make it easy to compare futures and spot prices right on one graph. When you set up a chart, you might add trendlines to show how prices move along with trading volumes. This visual method helps you quickly spot any shifts in supply and demand.
Mobile pricing apps add another layer of ease by offering daily market updates and sending alerts when prices hit your set limits. One trader put it simply: "I set alerts like a reminder to check my investments, simple and effective." Even if you’re away from your computer, these tools keep you connected to the market.
When you combine index reports, live data feeds, clear charting methods, and handy mobile apps, you get a complete monitoring system. This mix makes it easier to track trends and make decisions quickly in the fast-paced world of agricultural commodities.
Investment Strategies for Agricultural Commodity Prices
Long-term investors keep things simple. They focus on the basics, like the balance between supply and demand, changes in production costs, bottlenecks in logistics, and major policy shifts, rather than stressing over everyday price fluctuations. One trader once said, "I treat my market review articles like a trusted roadmap, guiding me through both calm and storm." This clear approach helps reduce the risk of overdoing futures trading, which can sometimes lead to margin calls.
Finding the right time to invest means looking closely at how quickly assets can be turned to cash (liquidity) and breaking down production costs. Investors often mix spot forward contracts, options (which give you the right to buy or sell at a set price), and indexing when creating hedging strategies. These tools work together to lower risk while keeping investment choices flexible in the agricultural futures market.
Here are a few key points:
| Focus Area | What It Means |
|---|---|
| Cost-Based Entry | Using detailed cost analysis to decide when to invest. |
| Logistics Evaluation | Examining transport and handling costs to avoid surprises. |
| Market Reviews | Following regular reports to fine-tune the timing of your moves. |
Keeping up with steady market reports and regularly checking liquidity levels can help you know exactly when to adjust your position. This blend of techniques not only helps you dodge short-term shocks but also builds a solid foundation for long-term investment success in a market driven by genuine economic trends and real operating costs.
Final Words
In the action, the post broke down agricultural commodity prices, offering a clear look at historical trends, current market drivers, and future forecasts. The discussion explained how weather, supply-demand shifts, and regional differences shape these prices. It also highlighted tools that help track real-time moves and investment strategies to cope with short-term ups and downs. All these insights show everyday investors how to use solid data when planning for a secure financial future. Keep applying these insights, and feel confident in your ability to act on emerging trends.
FAQ
What do agricultural commodity prices today (including USA) indicate?
Agricultural commodity prices today show current market values for basic goods like wheat, corn, and soybeans. US figures reflect domestic supply, demand, and market trends.
What information does an agricultural commodity prices chart or graph provide?
An agricultural commodity prices chart or graph visually presents price trends over time. It helps users quickly see shifts, patterns, and historical comparisons in market values.
What are today’s grain market prices per bushel?
Today’s grain market prices per bushel reveal the current cost for grains such as corn and wheat. This data assists buyers and sellers in understanding immediate market conditions.
What does agricultural commodity prices by year show?
Agricultural commodity prices by year display historical trends in market values. They help illustrate how prices have shifted over time, aiding in future market forecasts.
What is included in an agriculture commodities list?
An agriculture commodities list covers basic raw materials used in food production, such as wheat, corn, soybeans, coffee, and other similar items.
Why are agricultural commodity prices falling?
Agricultural commodity prices are falling due to factors like surplus supply, weather impacts, and changing global demand, which together affect the balance between what is produced and what is needed.
Are corn prices up or down, and what is the cash price for corn and soybeans?
Corn prices can fluctuate based on market conditions, while cash prices for corn and soybeans reflect current spot rates for immediate delivery, driven by supply, demand, and government policies.
What is happening to commodity prices?
Commodity prices are declining partly because global economic pressures and shifts in supply and demand influence the market. Monitoring the latest reports can provide more detailed insights.