
31 C
Los Angeles
Monday, July 27, 2026

What Is A Good Credit Score: Financial Wins

Understanding what is a good credit score can reshape your financial future. But wait, could one hidden factor tip the scales?

Are Robo Advisors Worth It: A Smart Choice

Curious if robo advisors truly deliver value compared to human advice? The analysis reveals surprises that may change your perspective...

Robo Advisor: Smart, Safe, Automated Investing

Curious how a robo advisor revolutionizes investing with automated precision and surprisingly lower fees, could it completely redefine your financial future?
Home Blog Page 4

Passive Investing Strategies For Steady Wealth

0

Have you ever wondered if you really need to beat the market to build lasting wealth? The truth is you don't. Think of passive investing like planting a seed today so you can enjoy cool shade tomorrow. By keeping a mix of low-cost funds over time, you avoid extra fees and let your money grow quietly.

In this post, we share simple steps to help your money work steadily in the background. Whether you are saving for college or planning for retirement, this approach brings steady, calm growth to your financial goals.

Passive Investing Strategies Explained: Core Principles

Passive investing means buying securities and holding on to them for the long run. Instead of trying to time the market with frequent trades, you build a diverse portfolio using tools like index funds, mutual funds, or ETFs. Imagine it like planting a tree, you start with a seed today and enjoy its shade tomorrow. Trading less often helps you dodge extra fees and lower management costs, giving your money a better chance to grow.

The key is to let your investments sit over time so the market's growth can add up. Think of your portfolio like a slow-cooking stew; the ingredients need time to mix and develop a rich flavor. This steady plan can help lower costs and smooth out the effects of short-term ups and downs.

One downside is that fund managers usually run these portfolios, meaning you have less control over customization. Unlike active management, where you tweak your investments to match market changes, passive strategies stick to a fixed plan. This makes it a smart choice for long-term goals, like saving for retirement or education, where you want your money to work quietly in the background.

Overall, passive investing gives you a clear, low-cost way to benefit from overall market growth. It’s perfect if you’re more interested in steady, long-term results than in chasing the daily market swings.

Building a Passive Portfolio with Low-Cost Index Funds and ETFs
img-1.jpg

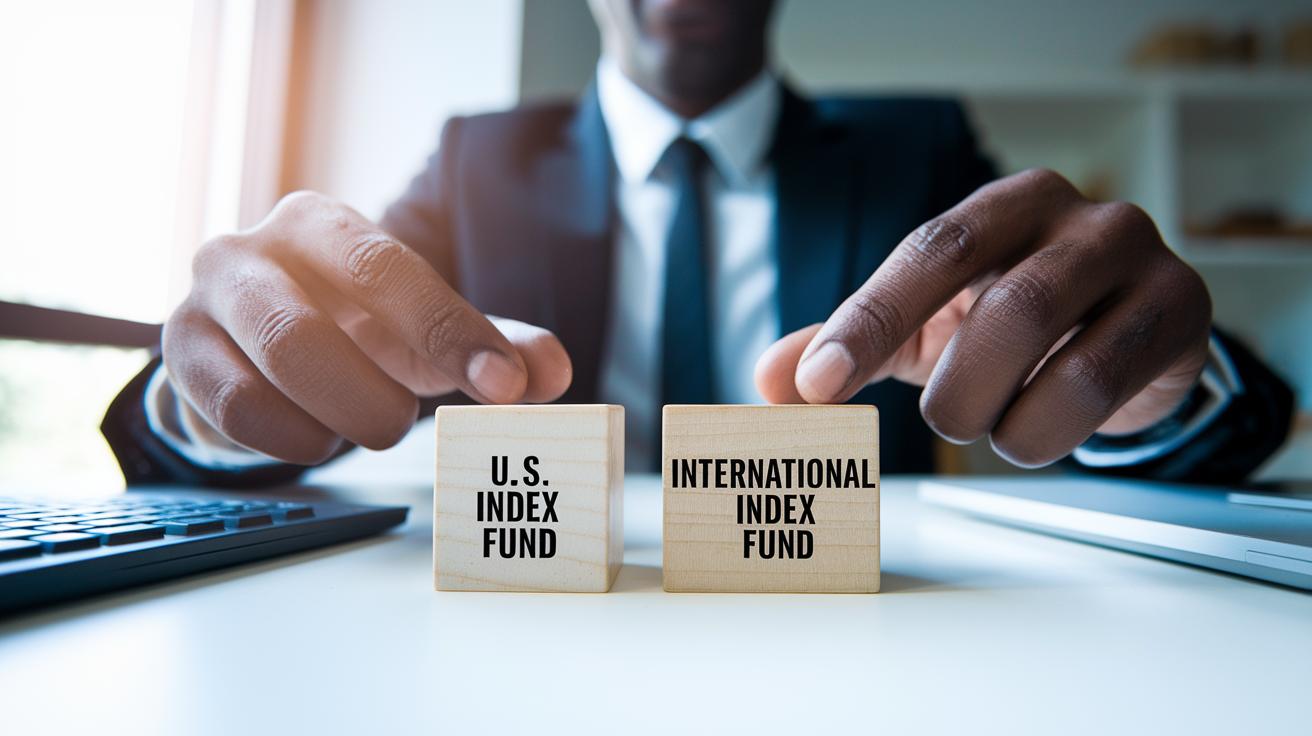
When you build a passive portfolio, low-cost index funds and ETFs form the steady foundation for long-term growth. Think of each one as a building block that fits into the larger market puzzle. By choosing both US and international index funds along with broad-market ETFs, you keep your investment simple while getting full market exposure at a low cost.

These funds usually charge fees between 0.03% and 0.20%, which is much lower than what actively managed mutual funds require. Lower fees mean more of your money stays with you instead of being eaten up by expenses. Imagine low-cost index funds as a gentle tap that slowly fills your savings over time. A quick tip: always check the fee percentage before you invest, because even a small fee difference can add up over time.

Diversification is another key strategy. Mixing different funds spreads out your risk by covering various sectors and markets. Picture your portfolio like a balanced meal where every ingredient plays a part in keeping it healthy. Combining funds that include large US companies with those that cover international markets can help smooth out the bumps along your investment journey.

If you're just starting out, taking a look at the basics can really help. Think of learning about investing like assembling a puzzle where each piece plays a role in making the whole picture clear.

Automated Asset Allocation in Passive Investing Strategies

Automated asset allocation tools, like robo-advisors and digital platforms, let you set clear targets for how your money is split among different investments while handling the everyday work. It’s a bit like programming your coffee maker to brew your perfect cup every morning, simple, reliable, and consistent.

These systems are designed to keep your investments on track. They use triggers to rebalance your portfolio, either on a set schedule or when things move beyond a certain point. Imagine a thermostat that keeps your home at a steady temperature; that's how these triggers work to prevent your portfolio from drifting away from your goals.

Many of these automated solutions also include smart tax strategies. Ideas like dividend reinvestment, where any money your investments make is automatically used to buy more shares, and tax-loss harvesting, which helps reduce your tax bill by managing losses, are built right in. With these features, you can leave the more complex calculations to the system and ease your mind about market timing.

In short, automated asset allocation brings modern technology and smart investing together to give you a steady, hands-off approach to growing your wealth.

Comparing ETFs and Index Mutual Funds for Passive Investing

img-2.jpg

ETFs and index mutual funds both give you a way to invest without constantly managing your portfolio, but they work differently. ETFs are traded like stocks during the day, so you can buy or sell them whenever the market is open. Index mutual funds, on the other hand, only complete trades at the end of the day when their value is set. Imagine being able to add to your portfolio at lunchtime, it's as easy as grabbing your favorite cup of coffee!

Another key difference is the minimum amount needed to start. With ETFs, you can begin with just one share, making it accessible if you're new to investing. Index mutual funds usually require a larger sum upfront, sometimes between $500 and $3,000. That extra requirement can be a hurdle if you're just getting started or prefer a smaller, simpler approach.

Expense ratios also tell a familiar story. Both ETFs and index mutual funds often have low fees, sometimes as little as 0.03%, though index mutual funds might occasionally be a bit higher. Think of the expense ratio as a small fee that gently lowers your overall return, a fee you’d want to keep as low as possible.

Finally, consider how each keeps track with the index. ETFs often use a sampling method, picking key stocks to mirror the index. Meanwhile, index mutual funds try to match the complete index exactly, like following a recipe to the letter. Your choice may ultimately depend on whether you prefer an approximate approach or an exact one when it comes to tracking the market.

Benefits and Drawbacks of Passive Investing Strategies

Passive investing keeps your costs low while letting your money grow steadily over time. It uses basic funds that follow the overall market, which means your investments are spread out over many assets. Think of it like a balanced meal, every part plays its role without one ingredient taking over.

This approach also smooths out the ups and downs of daily market changes. Over time, short-term fluctuations balance out, which makes it easier not to panic when things dip. It helps you stay on track with long-term goals like saving for retirement or paying for education.

But there are some challenges. Since passive strategies stick closely to market trends, they don’t adjust quickly when the market drops. This means you might still feel the impact of a downturn because the entire market moves together. If you’re looking for rapid gains or targeting specific sectors, this type of investing might not be the perfect fit.

Here are a few main points to think about:

  • Low-cost approach that helps your money grow.
  • Diversified exposure that balances market ups and downs.
  • Limited flexibility during fast market changes.

Steps to Implement Your Passive Investing Strategy

img-3.jpg

Start by setting clear, long-term goals that serve as the blueprint for your financial freedom. Think of these goals as the plan that guides you, like mapping out a low-maintenance retirement strategy, knowing where you want to be helps you pick the best route.

Here’s how to build your passive investing plan:

  • Set clear goals, like saving for retirement or funding education. This step acts as your roadmap for growing your wealth.
  • Choose funds that fit your style. Look into a mix of domestic and international stocks, bonds, and even real estate. Imagine it like selecting the best ingredients for a balanced meal.
  • Set up automatic contributions and plan to rebalance your portfolio every few months or annually. This method keeps your strategy on track without needing constant attention.
  • Check your progress each year, and tweak your plan only if your goals or comfort with risk change.

Think of these steps as putting together a well-oiled machine that works for many years. Every piece you add helps build steady wealth while keeping your investing simple and focused on long-term security.

Final Words

In the action, we broke down how low-cost index funds, ETFs, and automated allocation tools work together to build a solid, diversified portfolio. The discussion covered the strengths and limits of a buy and hold approach, all keeping an eye on cost efficiency and long-term market tracking. The blog also compared various fund types, giving clear steps for those ready to launch their plan. With a friendly outlook and clear guidance, embracing passive investing strategies can set you on the path to steady financial growth.

FAQ

What are passive investing strategies for beginners?

Passive investing for beginners means buying and holding low-cost funds, like index funds or ETFs, that follow the market over the long run. This approach minimizes fees and helps avoid the stress of constant trading.

What is the goal of passive investing?

The goal of passive investing is to match overall market returns rather than beat them. Investors aim to lower costs and reduce the chance of emotional trading while enjoying steady market exposure.

Does passive investing carry lower or higher risk?

Passive investing is designed to offer lower risk by spreading investments across many stocks or funds. While it won’t protect from market downturns, it helps avoid errors from frequent trading and market timing.

What are some examples of passive investment strategies?

Examples of passive investment strategies include buying diversified index funds and ETFs that track entire markets. A buy-and-hold approach along with automated rebalancing can support long-term financial goals.

Who manages passive investment funds?

In passive investing, fund managers follow preset market indices. They stick to a buy-and-hold strategy that mirrors broad market performance, keeping management decisions consistent and simple.

What does passive investing mean?

Passive investing means purchasing investments for long-term holding so that your portfolio mirrors market performance. This strategy avoids frequent trading, focusing on low costs and steady growth over time.

How can I make $1,000 a month passively?

Making $1,000 a month passively usually comes from building a portfolio that generates regular income through dividends or interest. It takes time, careful planning, and the right mix of investments to reach that goal.

What is the 70/30 rule attributed to Warren Buffett?

The 70/30 rule suggests dividing investments with about 70% in safer, steady assets and 30% in growth-oriented options. This allocation balance helps meet both income and growth needs based on your risk profile.

What is the 10/5/3 rule of investment?

The 10/5/3 rule is a guideline for setting investment and saving targets. It typically advises allocating percentages of your funds for investing, saving, and spending reviews, though interpretations can vary among investors.
What Do Economic Indicators Measure: Clear Market Trends

0

Ever wonder how small numbers can tell a big story about our economy? Think of economic indicators as snapshots of our financial life. They measure things like how much is being made, the prices we pay every day, and how many people are working.

These numbers work a bit like a camera, capturing moments that help us see market trends. In this post, we look at important figures such as Gross Domestic Product (GDP, which is the total value of goods and services produced), the Consumer Price Index (a measure of typical price changes, so you know how much prices rise or fall), and the unemployment rate. Together, these metrics help us figure out if our economy is on the up or facing some rough patches.

Core Economic Metrics: What Economic Indicators Measure

Economic indicators are numbers that help us understand how well our economy is doing. They offer a simple way to see how the economy's overall health improves or declines over time. One key indicator is GDP, which represents the inflation-adjusted total of all final goods and services produced in a country. Think of GDP as a wide-angle snapshot, it’s like counting every item sold in your local market to get a feel for the overall business activity.

Another important metric is the Consumer Price Index (CPI). This measures the price changes of everyday items like food, clothing, and transportation that urban households typically buy. By tracking CPI, we can see how the cost of living shifts over time. Even a small change in prices can make a big difference to household budgets, hinting at larger trends in the economy.

The unemployment rate is another crucial figure. It shows the percentage of people in the labor force who are actively looking for work. Updated monthly alongside other job data, it’s like checking the pulse of the job market. When unemployment is high, it may signal that the economy is under stress, whereas lower rates usually mean more people are working and economic activity is healthier.

Together, these indicators, GDP, CPI, and unemployment, help paint a clear picture of market trends and the overall state of economic performance.

Timing Economic Activity: Leading, Lagging, and Coincident Indicators

img-1.jpg

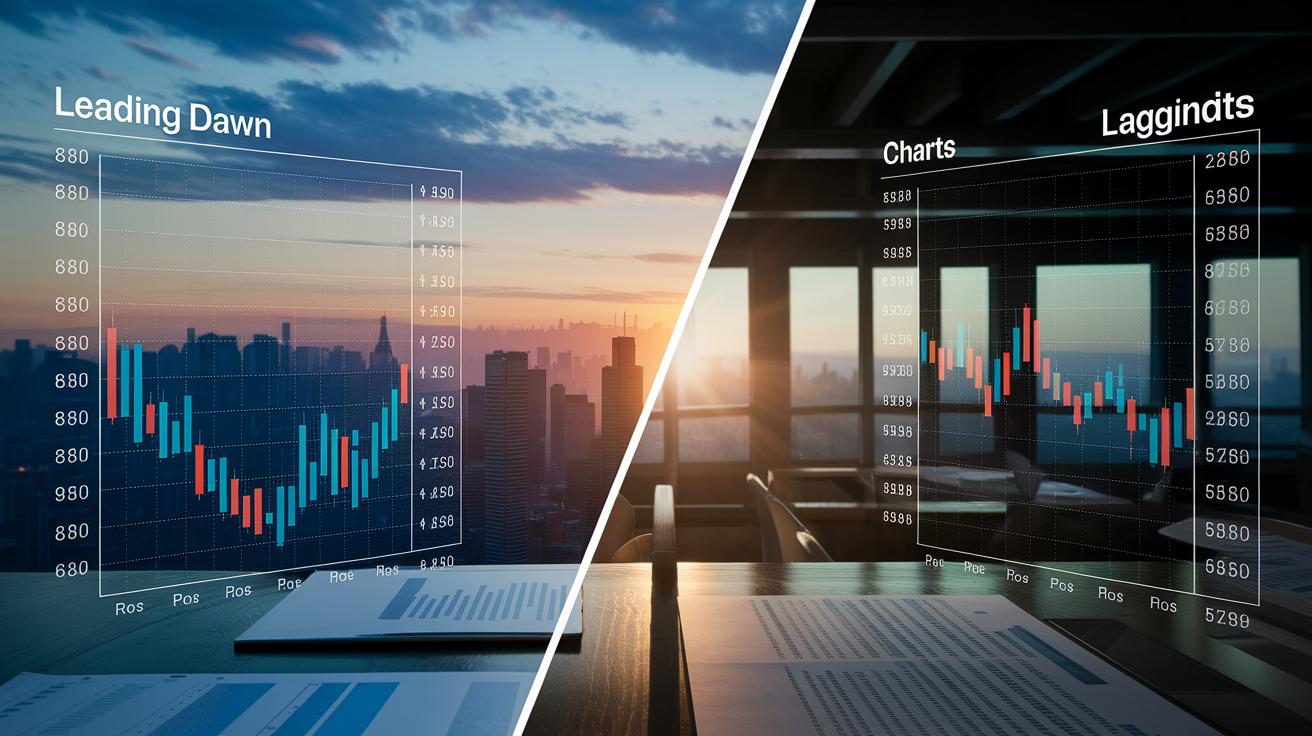
Economic indicators come in different types based on when they reveal information about the market. Leading indicators give us early hints about what could happen next. For instance, changes in consumer confidence or stock market ups and downs can warn us of future shifts in the economy. It is much like noticing the first light of dawn before the full sunrise.

Lagging indicators, on the other hand, confirm trends that have already happened. Numbers such as the unemployment rate, interest rates, or the cost for goods from producers show how past events are affecting us today. Think of it as looking at yesterday's weather to help understand today's conditions.

Coincident indicators show us what is happening right now. Retail sales, new housing projects, and current GDP numbers provide a clear picture of today's economic activity. They help us see which part of the economic cycle we are in, whether it is growing, reaching a peak, slowing down, or bottoming out.

Each category plays an important role in helping analysts, businesses, and policy makers understand our economy and make better decisions.

GDP Indicators: Measuring Total Output and Growth

Imagine checking a country's report card to see how much it makes. GDP does just that, it tells us how much a country produces, adjusted for rising prices. In plain English, it sums up the final goods and services made within a country's borders.

There are two main ways to measure GDP. One way, the expenditure method, adds up everything spent on goods and services. This includes money spent by consumers, businesses, and the government, plus the difference between what a country exports and imports. Think of it like adding up every dollar spent in one busy marketplace to see the full picture.

The other way is the income method. Instead of tracking spending, it totals up all the income earned from production. That means wages, rents, interest, and profits earned from producing goods and services. In other words, it’s like gathering up the earnings of everyone working in that same bustling marketplace.

When GDP goes up, it usually signals that the economy is growing, much like a business making more sales. On the other hand, a drop in GDP might signal a slowdown or hint at a recession.

Economists, analysts, and policymakers look at these changes to understand overall growth and compare performance over time. These important numbers help guide decisions and shape expectations for the future, like looking ahead to 2025.

Inflation Indicators: Tracking Price Stability with CPI and PPI

img-2.jpg

CPI stands for the Consumer Price Index. Think of it like your usual shopping list with the same items every time you visit the store. When the total price of that list goes up, it shows that living expenses are rising. People who make economic decisions use this measure to see how price changes are affecting everyday budgets and to help decide on interest rate tweaks.

PPI stands for the Producer Price Index. This tool checks the prices domestic companies get for their goods in areas like manufacturing, farming, or mining. Picture it as an early signal. For instance, if the cost of basic materials increases, companies might eventually pass those costs on to you at the store. When CPI numbers steadily rise, it hints at continuing inflation, while steady or lower readings can point to a decrease in prices.

Both CPI and PPI are key when it comes to keeping an eye on price stability and how living costs change. They help experts and decision-makers understand market pressures, so we can see clearer how changes in daily expenses and production costs shape the economy.

Unemployment Indicators: Gauging Labor Market Dynamics

When we talk about the unemployment rate, we mean the number of people actively searching for jobs. Every month, the Bureau of Labor Statistics releases these numbers along with nonfarm payroll data, kind of like checking a neighborhood bulletin board for new opportunities.

The labor force participation rate tells us how many working-age people are in play, whether they’re employed or looking for work. It gives us a glimpse into whether more people want to join the workforce or if they’re stepping away.

Then there’s average hourly earnings and wage growth. Rising wages usually show that workers are making more money, which can boost spending in local communities. On the flip side, if wages remain flat or drop, households might start cutting back, and that can slow down the economy.

When unemployment is high, it often goes hand in hand with fewer jobs and less spending. Tracking these numbers helps us understand the overall health of the labor market and shapes the conversation around economic well-being.

Here are some key points:

  • Unemployment tracking
  • Labor market trends
  • Labor force participation
  • Understanding wage growth

img-3.jpg

Interest rates show what you might pay when borrowing money. When the Federal Reserve changes the Federal Funds Rate, it affects loans and mortgages. When the Fed lowers rates, borrowing becomes cheaper, which can encourage more spending and investment. It’s a bit like adjusting a dimmer switch: turning it up brightens the room.

Measures like M1 and M2 help us see how much money is moving around in the economy. M1 includes the cash you use every day and money in checking accounts. M2 adds savings accounts and small time deposits. This tells us if there is more cash flowing, much like more water in a reservoir leads to a bigger flow downstream.

Market trends are important too. Changes in stock prices and trading volumes can hint at future shifts in the economy. Tools like the VIX, known as the "fear gauge," show how nervous investors are about the market. When the VIX goes up, it might be a signal that a downturn is coming, giving smart investors an early heads up.

By keeping an eye on interest rates and money supply at the same time, we get a clearer picture of how money-related decisions impact our overall economic stability. In short, these financial signs show how government policy and market sentiment work together to shape our financial future.

Composite and leading indicators give you a quick peek at where the market might be headed. They mix different details to hint at future changes. For example, the Consumer Confidence Index checks how positive people feel about their spending and budgets. When confidence is high, spending can shift, much like the buzz before a local festival gets everyone excited to shop.

Retail sales numbers also offer clues about everyday spending and hint at rising prices. These figures come from monthly data gathered by the U.S. Census. Imagine looking over receipts at your local store to see if more people are buying their essentials.

The Purchasing Managers’ Index, or PMI, tells us how the manufacturing side of the economy is doing. When the PMI is above 50, it means factories are growing. Picture a factory speeding up production because of lots of new orders, a sign that business feels optimistic.

Housing starts and building permits show early signs of changes in the home market. By watching how many new homes begin construction, experts can spot shifts in the housing trend.

Composite indexes like the Conference Board Leading Economic Index bring several data points together into one clear number. This index can even give a warning about a potential recession. Think of it as putting together a puzzle where each piece, from retail sales to consumer mood, helps reveal the full picture of our economic trends.

Final Words

In the action, this piece covered how GDP, CPI, unemployment, and other measures reveal clues about our economy. We broke down the timing of indicators and looked at market signals that help forecast trends. Small, clear steps connect the data points to everyday decisions. All these insights show what do economic indicators measure and how they lead to better financial security and growth. The information we shared can serve as a helpful guide for making smart, confident financial choices.

FAQ

What are economic indicators and what do they measure in business?

Economic indicators are statistical metrics that show the state of an economy. They measure overall output, price trends, and employment levels, helping businesses gauge performance and plan strategies.

What are some examples of economic indicators?

Economic indicators include GDP, CPI, unemployment rates, retail sales, and business confidence indexes. These examples help assess market trends and predict economic shifts.

What are the five key economic indicators?

The five key economic indicators typically include GDP, CPI, unemployment rate, consumer spending, and retail sales. These metrics provide a solid snapshot of economic performance from multiple angles.

What are the three primary economic indicators?

The three primary economic indicators are GDP, CPI, and unemployment rate. They track overall production, price stability, and labor market health, giving insight into a country’s economic condition.

What do economic indicators tell you about an economy?

Economic indicators tell you how an economy is faring by tracking output, price changes, and employment trends. They signal both current conditions and potential future shifts.

What do leading economic indicators do?

Leading economic indicators forecast future economic trends. They include measures like consumer confidence and stock market activity, giving early signals of possible changes before the overall economy shifts.

Why are economic indicators important to a company?

Economic indicators are important because they offer data on market trends and consumer behavior. Companies use this information to manage risks, adjust strategies, and seize growth opportunities.

What are microeconomic indicators?

Microeconomic indicators focus on specific sectors or regions. They look at detailed metrics like local pricing trends and regional employment, helping businesses understand localized economic activity.

How are economic indicators used to measure overall economic health?

Economic indicators such as GDP, CPI, and unemployment rates are used to measure overall economic health. They offer insights into growth, pricing pressures, and labor market conditions, forming a comprehensive performance picture.

What do economic indicators monitor?

Economic indicators monitor growth, consumer spending, price changes, and utilization of labor. They provide essential insights into market strengths and help highlight challenges in the broader economy.

Template For Market Analysis Sparks Winning Insights

Have you ever wondered why some businesses easily turn a pile of numbers into clear insights while others feel overwhelmed by the data? This template is like a simple map that helps you cut through the noise. It shows you how to set up your space, guess your possible income, and list your customer choices, just like planning a smooth route on a road trip. Think of it as a step-by-step guide that turns tricky stats into clear, useful directions. Ready to see how a smart plan can point you toward success?

Comprehensive Template for Market Analysis

This template is a step-by-step guide that covers the entire market analysis process. It starts with a clear one-sentence definition of the market, then helps you map the customer decision journey and spot the main competitors. Think of it as a reliable roadmap that turns a flood of market data into solid, focused insights.

The guide breaks everything down into simple sections. You’ll find parts on defining your market, estimating potential revenue streams, and grouping customers to understand how they make choices. It even includes a basic trend impact analysis chart to track larger market trends and assess risks. Typically, reports created with this template range from 15 to 30 pages, though a smaller project or early review might only need 5 to 10 pages.

Deciding whether to use a full report or a shorter version comes down to your project’s needs. For projects needing deep insight and detailed competitor information, the full report is your best bet. However, if you’re working on a smaller initiative or just starting out with early-stage ideas, a concise report will still provide the essential data without overwhelming you.

Market Definition and Sizing Template for Market Analysis

img-1.jpg

Start your analysis by defining the industry clearly in one simple sentence. This sets the stage and makes sure everyone focuses on the main parts of your review. Next, figure out your market size by working out three key numbers: TAM (Total Addressable Market), SAM (Serviceable Available Market), and SOM (Serviceable Obtainable Market). For TAM, think of it as the full potential revenue from your market. Then, using a top-down approach, like checking overall industry revenue reports, and a bottom-up approach, like looking at unit economics and performance metrics, you can get solid estimates. This way, your numbers feel right and come with clear, easy-to-follow reasoning.

Step Description Example Data Source
Define Market Boundary Write one sentence that sums up the core industry Industry white papers
Total Addressable Market (TAM) Estimate the overall market revenue from a broad view Industry revenue reports
Serviceable Available Market (SAM) Narrow down the potential by focusing on specific segments Market segmentation studies
Serviceable Obtainable Market (SOM) Calculate your share of the market with a detailed approach Sales data analytics

Double-check your numbers by verifying your sources and showing your calculation steps. This makes sure that your assumptions match trusted industry figures and gives you confidence in your market size estimates.

Competitive Analysis Template for Market Analysis

Start your review by grouping your competitors into simple tiers. Begin with Tier 1 players who hold a major share of the market, move on to Tier 2 participants that dominate smaller niches, and finish with emerging companies that are quickly making a name for themselves. This way, you can focus on the main rivals while keeping an eye out for opportunities to innovate.

Next, sketch a basic positioning map that shows what each competitor does well and where they fall short. You might use a method like Porter's Five Forces (a framework that looks at competition, pricing, and more) to get a clear picture of the market. Compare things like price, market share, product quality, and customer service. If you want to dive deeper into performance numbers, check out Financial performance analysis. This guide gives a straightforward look at how each competitor measures up against industry challenges and what improvements could be made.

Lastly, look at real-world examples to bring these ideas to life. For example, Microsoft studied 31,000 workers to see how their AI Copilot tools were performing and to identify opportunities. And Snapchat adjusted its market stance to address social media fatigue. These stories show that using real data can sharpen your strategy and help you set strong benchmarks.

SWOT & PESTLE Assessment Template for Market Analysis

img-2.jpg

Using both a SWOT analysis and a PESTLE assessment gives you a well-rounded look at your business. It’s like checking your car’s engine and the road before a long drive. First, take a quick look inside your business to see what you do well and where you could improve. Then, expand your view to include things outside your company, like legal changes or shifts in public opinion.

For your SWOT part, make a list of:

  1. Strengths
  2. Weaknesses
  3. Opportunities
  4. Threats

Then, check out the external environment by considering these factors:

Factor Description
Political Rules and government policies that might affect your business.
Economic How market trends and economic shifts can influence your outcomes.
Social Changes in society and customer attitudes.
Technological Advances in technology that can affect operations.
Legal New laws and regulations that might impact your plans.
Environmental Factors like sustainability and environmental practices.

By matching what you find inside with what’s happening outside, you can spot where improvements might be needed and where new chances are popping up. For example, if one of your powerful strengths meets a favorable economic trend, you might be ready to expand confidently. This clear, step-by-step method helps you turn detailed information into practical actions that keep you in tune with both your strengths and the outside world.

Trend Analysis & Economic Forecast Template for Market Analysis

Begin by looking at market trends with a fresh perspective on how things change over time. A trend impact analysis chart set up as a simple 2×2 matrix lets you sort trends by their quick effects and how certain they are. Think of it like placing markers on a map to show which trends move fast and which develop slowly. For instance, one small change in consumer behavior might point to a big shift looming ahead, making these insights both easy to see and act on.

Building the matrix is simple. Write down the trends along one edge and sort them as short-term, medium-term, or long-term. Then, mark each trend based on its influence and your confidence in its future. Imagine a trend like rapid mobile adoption sitting squarely in the high-impact and high-certainty box. This clear layout helps you see which factors might drive future market changes and which ones could bring risks.

Focus on the trends that have a big impact to improve your strategic decisions. Look at the major shifts in the economic outlook that signal strong growth drivers or potential risks. This method turns a jumble of data into clear, practical insights that guide your next steps.

Financial Forecasting Schema & Scenario Template for Market Analysis

img-3.jpg

Our financial forecasting system mixes past trends with future expectations. We combine revenue predictions with estimates of market size and growth, using tools like compound annual growth rate (CAGR, which shows how fast an investment grows each year) to guide us. This easy-to-follow guide helps you build forecasts that rely on both history and smart predictions, giving you a clear plan for making informed decisions.

Base-Case Forecast

For the base-case forecast, we start by using past revenue numbers and industry growth estimates. We work with steady data such as regular sales trends, operating costs, and typical market behavior. This method uses average growth rates so that your forecast feels both natural and reliable. It gives you a realistic look at what to expect financially.

Upside & Downside Scenarios

In our upside and downside scenarios, we change key numbers to explore both optimistic and careful outcomes. We test different ideas like shifts in growth, changes in market share, and variations in cost. This lets you compare multiple financial plans and see how small changes can impact revenue. For more detailed examples, you can check out Quantitative financial modeling at https://tradewiselly.com?p=4555. This step helps you clearly see both the risks and the opportunities.

When you turn these forecasts into smart strategies, you get practical advice that guides your business planning for both the short and long term. It transforms basic financial data into clear, step-by-step insights to help you use your resources wisely and boost growth.

Final Words

In the action, this blog post laid out a comprehensive framework to build your template for market analysis. It walked you through defining the market, sizing it properly, evaluating competitors, and weighing SWOT and PESTLE factors alongside trend and financial forecasts.

Breaking down each section into clear, digestible parts makes the process easier to apply. This simple, reliable guide gives you the tools needed to make informed decisions and pursue a secure financial future with confidence.

FAQ

What is a market analysis template?

A market analysis template provides a ready-to-use structure to assess market size, competitors, trends, and financial forecasts. It guides you in crafting clear and effective strategic insights.

How do I write a market analysis?

Writing a market analysis means you define your market, measure its size with methods like TAM, SAM, SOM, assess the competition, and review market trends for informed decision-making.

What are the common steps in market analysis?

The steps in market analysis involve setting clear market boundaries, sizing the market, mapping competitors, evaluating trends, and forecasting financial outcomes to build a complete strategic picture.

What formats of market analysis templates are available?

Market analysis templates are available in different formats such as free downloads, PowerPoint presentations, Word documents, Excel sheets, and PDF files to fit your presentation needs.

What can I learn from a market analysis report example?

A market analysis report example shows you how to display core components like market size, competitive data, SWOT/PESTLE findings, and financial forecasts in a structured document.

Which market analysis tools can help with my business plan?

Market analysis tools, including frameworks and templates, help you define the market, analyze competitive landscapes and trends, and solidify financial estimates, all of which support a robust business plan.

How To Achieve Financial Freedom For Lasting Prosperity

0

Have you ever wondered how a few simple money habits could lead to a more secure future? It might sound surprising, but even small changes can add up. For example, tracking your spending, setting a clear budget, and saving a little bit every payday can help you build lasting prosperity.

In this article, we’re going to walk through some easy steps that help with everyday money matters. We’ll talk about keeping an eye on your daily expenses, paying off debts, and even using smart investing to boost your income. Stick with us and see how you can take control of your money while working toward true financial freedom.

Core Steps to Achieve Financial Freedom

Your journey to financial freedom starts with clear, simple steps that help you control your money and see your wealth grow over time. First, get a good handle on your cash flow by knowing exactly how much money comes in and where it goes. Even small daily buys, like that morning coffee, can sneak up on you if you’re not keeping track.

  • Keep track of your income and spending.
    Write down every expense, even the little ones, to reveal any hidden money drains.

  • Set up and stick to a household budget.
    Think of it like planning a meal: list out all your expenses and make sure they fit within your available money.

  • Put together an emergency fund that covers 3–6 months of expenses.
    Save a little money each payday until you've built a safety net for unexpected costs, like a sudden repair or a change at work.

  • Work on paying off high-interest debts such as credit cards, car loans, or mortgages.
    Paying only the minimum can add up fast, so tackling these balances early can save you years of extra costs.

  • Look for ways to boost your income.
    Whether it's asking for a raise, switching to a better job, or picking up a side gig, an extra boost in cash flow can help you reach your goals sooner.

  • Begin investing early for passive income with diversified options like stocks, bonds, or real estate.
    The aim is for your passive income, money earned without constant work, to eventually cover your living expenses.

  • Keep an eye on your credit score to enjoy better loan deals.
    Regular checks can help you spot errors and improve your credit, leading to more favorable borrowing terms.

  • Don't hesitate to ask a financial expert for advice when needed.
    Sometimes a fresh perspective can transform how you manage your money.

Each of these steps is part of a whole strategy that combines budgeting, saving, investing, and debt management to build a secure future.

Strategic Budgeting and Saving Tactics for Independence

img-1.jpg

Begin by creating a simple household budget that guides your journey to financial freedom. You want to know exactly where your money goes, so note every dollar you earn and spend. For example, a $5.65 latte twice a week might seem like nothing, but it actually adds up to more than $500 in a year. Think of it as spotting a small leak in a boat, minor at first, but it can eventually drain your resources.

Set up automatic transfers from your checking account to your savings account every payday. It’s a bit like setting an alarm clock for your money, once it’s set, you won’t forget. And, if you see any spending that isn’t really needed, try to use that money to pay off debts or add to your emergency fund.

Category Recommended % of Income Example
Housing 30% Rent or mortgage
Transportation 15% Car payment or fuel
Savings 20% Automatic transfers
Discretionary 10% Dining or entertainment

Picture each dollar you save as a building block for your financial future. These small, smart choices add up and help you move towards real independence.

Eliminating Debt on Your Pathway to Fiscal Autonomy

Clearing high-interest debt is a big step toward taking charge of your money. Imagine carrying a $1,000 balance on a credit card at 18 percent interest. If you only pay the minimum, you could be stuck with that debt for nearly 20 years. Even a small debt like this can grow a lot if interest keeps adding up, it might cost you over three times its original amount if left unchecked.

One good idea is to call your bank and ask if they can lower your interest rate. Setting up automatic payments can also help you avoid extra charges for late payments. It’s smart to check your credit reports from Equifax, Experian, and TransUnion regularly. This keeps you on track and helps fix any mistakes that could hurt your score.

Sticking to a plan for managing debt builds a solid foundation for a brighter financial future. When you cut down on high-interest balances first, you free up money that you can invest to help your money work for you. Every payment you make clears away a barrier, moving you closer to living life on your own terms. Keep moving forward and stay focused on your goals.

Building Wealth Through Investing

img-2.jpg

Start by building a mix of investments that helps balance risk and reward. Think of it like constructing a sturdy house, where each part plays an essential role. For example, you can set aside about 60% in stocks, which offer a chance for long-term growth, and the remaining 40% in bonds or similar assets, which help keep things stable.

When it comes to picking stocks, consider using value investing, a method that involves searching for quality companies available at a fair price. Check out more details on what value investing is here: what is value investing. Also, low-fee index funds and ETFs are a smart choice because they help reduce costs, letting you keep more of your money as your investments grow.

It’s a good idea to tweak your portfolio every year. This rebalancing means you adjust your investments back to your target mix if one part gets too heavy. Doing so keeps your portfolio well-balanced and focused on your long-term goals.

Before adding any new investment, take a close look at the company's basics and growth potential. This method of evaluating securities can help you make smarter choices. For a deeper dive into assessing stocks, have a look at fundamental analysis for value investing. Regular reviews like these can help set a strong foundation for steady, long-term financial growth.

Establishing Multiple Passive Income Streams

Passive income can ease the daily grind and build long-term wealth. One popular way to grow this income is through rental real estate.

Rental Income

Renting out property can bring in a steady return, typically netting about 5 to 7 percent after you cover expenses and deal with occasional empty months. If you're just starting out, take some time to learn about your local market and find properties where there’s always demand. You might finance your purchase with a regular mortgage or even partner up with other investors. It’s wise to set aside a little extra cash for repairs or times when your property might sit empty. For example, create a repair budget for things like a leaky roof so you’re not caught off guard.

Dividend Income

Another solid option is dividend-paying stocks. These investments allow you to receive regular cash payments, usually anywhere from 2 to 4 percent in yield, and you can even reinvest those dividends to help your money grow over time. By choosing well-established companies, you turn some active research into a more hands-off income approach.

Other ideas include lending money online through peer-to-peer platforms, earning royalties from creative work, or growing a small side business until it runs on its own. Even freelance or consulting work can evolve from project-based fees to a more steady cash flow if you systematize your efforts. Mixing these different income streams can help you build a strong and resilient financial base that leads you toward true financial freedom.

Long-Term Prosperity Planning and Early Retirement Blueprints

img-3.jpg

Planning for a secure future starts with setting clear goals. Written goals matter, a study found that only 3% of Harvard MBAs who set clear objectives out-earned their classmates over time. Picture it like this: you write down plans for an emergency fund, mark a debt-free date, and set a target net worth. These clear markers help build a roadmap to your financial independence. In other words, you want SMART goals: specific, measurable, achievable, relevant, and with a set time. For example, you might decide to save enough to strengthen your financial base or pinpoint when your passive income, money you earn without working, will cover your monthly expenses.

Setting Achievable Milestones

Break your big goals into smaller, more manageable milestones. Write down the net worth you aim for, record a target date to be debt-free, and decide how much you want to save over the next few years. Creating a timeline with clear checkpoints lets you see your progress and stays focused on long-term prosperity. Each milestone acts like a brick in the pathway to early retirement. It’s similar to planning your daily spending, where every little step makes your journey toward financial freedom more concrete.

Leveraging Compound Growth

Starting early gives your investments a real advantage through compound growth. Imagine this: investing $24,000 between ages 19 and 26 can yield three times the returns compared to putting in $102,000 starting at age 27. Plus, employer 401(k) plans add extra help, like a 5% match on a $50,000 salary, which means an extra $2,500. By reinvesting your earnings, you let your money grow over time. It’s a strategy that can pave the way for early or even partial retirement.

Final Words

In the action, this article covered practical steps like budgeting smart, cutting down debt, and diversifying investments. It also explored strategies for building passive income streams and planning for early retirement. We saw how setting clear goals and tracking progress can shape a solid route toward financial independence.

By mixing these everyday approaches with tried-and-true advice, readers now have a roadmap on how to achieve financial freedom while paving the way for growth and security. Here’s to a promising future in your personal money journey.

FAQ

What are the 7 steps to achieve financial freedom?

The seven steps include tracking income and expenses, creating a strict budget, building an emergency fund, eliminating high-interest debt, boosting your income, investing early, and keeping an eye on your credit score.

How can one achieve financial freedom in 5 years?

Achieving financial freedom in five years means cutting high-interest debt, budgeting carefully, increasing income through job upgrades or side gigs, and investing in assets that build passive income to cover your living expenses.

How can someone achieve financial freedom at a young age?

Achieving financial freedom early involves starting in your 20s by tracking your money, sticking to a budget, investing in low-cost funds, and letting compound growth work in your favor over time.

What is the difference between financial freedom and financial independence?

Financial freedom means having enough cash flow to cover living costs while financial independence refers to a secure, self-sufficient financial state where you feel comfortable without relying heavily on a paycheck.

How can one be financially independent without a job?

Being financially independent without a job means earning enough from passive income—like dividends, rent, or other recurring revenue streams—to cover your monthly living expenses.

What does the 70/30/10 rule in money mean?

The 70/30/10 rule suggests dividing your income so that 70% covers essential expenses, 30% goes toward savings and debt repayment, and 10% is reserved for personal spends or fun rewards.

What is the 3 6 9 rule in finance?

The 3 6 9 rule in finance is a guideline used by some to build up an emergency fund (three to six months of expenses) and maintain additional buffers, though definitions can vary among experts.

How can one be financially stable with a low income?

Financial stability on low income comes from strict budgeting, tracking all expenses, cutting unnecessary costs, and saving regularly—even small amounts—to build a reliable emergency fund.

What should be on a financial freedom checklist?

A checklist for financial freedom includes tracking income, setting a detailed budget, establishing an emergency fund, paying off high-interest debt, boosting income streams, and investing for long-term passive income.

What are examples of financial freedom jobs?

Financial freedom jobs can be high-paying roles with growth potential, gig work like freelancing, remote positions offering stock options, or consulting that builds supplementary passive income over time.

How can someone become financially stable?

Becoming financially stable requires tracking finances, following a solid budget, eliminating high-interest debt, building an emergency fund, and diversifying investments to balance growth with security.

What do financial freedom images depict?

Financial freedom images often show relaxed individuals enjoying life stress-free, smiling with financial charts, or symbols of balance and growth that represent a secure, self-sufficient money management approach.

Macro Economic Examples: Robust Real World Cases

0

Have you ever wondered how big economic numbers shape your daily life? Think of GDP as a way to measure a country’s total production, inflation as the force that can make your grocery bill higher, and unemployment as a sign of fewer jobs available.

In this post, we share real-life examples from the past to show how these numbers work together. We look at how economies bounce back after tough times and how prices sometimes change quickly. With these examples, you can see how shifts in these figures help guide government policies and even influence your own choices.

Real-World Macro Economic Examples of GDP Growth, Inflation, and Unemployment

When we talk about GDP growth, we mean how fast a country makes its goods and services. It's like taking the pulse of a nation’s economy. Consumer-price inflation is about how the prices of everyday items change, showing us shifts in the cost of living and your buying power.

Unemployment rates simply show the share of people looking for work. This number often hints at whether the job market is strong or struggling. Policymakers use these stats to decide if they should increase spending or adjust interest rates to help people borrow money.

Some real examples include:

  • U.S. GDP bouncing back after the 2008–09 recession
  • A big surge in U.S. consumer-price inflation in 2021
  • A global spike in unemployment during the COVID-19 shock in 2020
  • Japan facing a long deflation period in the 1990s
  • Eurozone inflation dropping amid energy shocks in 2015

These examples show how GDP, inflation, and unemployment all work together to give us a snapshot of economic health. A rising GDP usually means businesses are doing well and consumers feel confident. Changes in inflation can affect your grocery bill and household budget, prompting banks to adjust financial policies. And unemployment rates help us understand how the job market is really doing. Together, these indicators help governments, investors, and even everyday people make smart decisions about the economy.

Fiscal Policy Macro Economic Examples in Government Spending and Taxation

img-1.jpg

Fiscal expansion is when the government spends more money to get the economy moving, especially when people and businesses aren’t spending much on their own. It’s meant to create jobs, encourage companies to invest, and boost overall production during slow times.

2009 U.S. ARRA Stimulus

Back in 2009, the U.S. government rolled out a $787 billion package known as the ARRA Stimulus. In simple terms, experts believed that every dollar spent created another $1.50 in economic growth. This move turned government spending into a spark that helped the economy find its footing after a serious downturn.

2022 U.K. VAT Cut

Over in the United Kingdom in 2022, the VAT rate was dropped from 20% to 5%. This cut made everyday items cheaper and nudged consumers to spend a bit more. It’s a clear example of how changing tax rates can quickly boost demand in the market.

Crowding Out Effects

Looking back to the 1980s, big government deficits pushed up interest rates, which meant companies faced higher borrowing costs. As a result, many businesses had to hold back or reduce their investment plans, even when the market looked promising.

In short, while boosting government spending and tweaking taxes can give the economy a quick lift, these moves also bring up worries about future debt and limits on private investment.

Monetary Policy Macro Economic Examples of Interest Rates and Quantitative Easing

Central banks play a big role in keeping our financial system steady. They adjust interest rates and control how much money is available. This helps keep prices stable and makes borrowing money more attractive so that spending helps the economy grow.

Federal Reserve Rate Cuts in 2020

Back in 2020, the Federal Reserve lowered its main rate from 1.75% down to almost zero. This change made mortgage rates drop, meaning home loans became easier for many families. It also encouraged companies to borrow money for new projects. In tough times, having cheaper credit helped both households and businesses manage better.

ECB Quantitative Easing Program (2015–2018)

From 2015 to 2018, the European Central Bank kicked off a huge asset purchase plan worth €2.3 trillion. Imagine it as adding extra money into the eurozone. By buying assets, the ECB increased the money supply and helped reduce borrowing costs. This step made it easier for people and companies to spend money, which in turn kept inflation in check.

Together, these moves help keep the economy on track. Lower interest rates and large-scale asset purchases speed up borrowing and spending, boosting overall demand. As demand grows, prices tend to stay more stable. These strategies create a safer and more predictable financial space during uncertain times.

Business Cycle Macro Economic Examples Across Expansion and Contraction Phases

img-2.jpg

Economic cycles show how an economy grows and slows down over time. We can think of these cycles as a natural beat, sometimes things are on the upswing and other times they dip. When businesses produce more and hire more people, that's an expansion phase. As the economy heats up and resources stretch to their limits, a peak can be reached, often signaled by changes in investor behavior. After the peak, falling output and rising unemployment mark a contraction. Finally, a trough appears when the economy starts to bounce back. These clear phases help analysts make sense of what might happen next.

Phase Description Historical Example
Expansion Rising output & employment U.S. 2010–2019 recovery
Peak Capacity constraints & overheating Dot-com peak in 2000
Contraction Falling GDP & rising unemployment 2008–09 Global Financial Crisis
Trough Turnaround begins U.S. trough in Q2 2020 (COVID shock)

Cycle analysis gives us good clues about where the economy may head next. Recognizing the signs in each phase can help you understand shifts that may affect everyday money decisions. By looking at these patterns, we connect theory with real-time trends and give guidance to policy makers and investors as they adjust to changing economic conditions.

International Macro Economic Examples in Trade and Exchange Rate Dynamics

Trade balance shifts show us how tough it can be to manage an open economy. Back in 2018, the trade tensions between China and the U.S. taught us that when import and export levels change, a nation’s economic balance can turn on a dime. These adjustments often happen when policies change suddenly or market moods shift. For more details on trade imbalances, see italy debt to gdp ratio.

Exchange rate swings are another big player in global finance. You might recall how the British pound bounced around after the Brexit vote in 2016. That volatility not only changed the cost of imports but also influenced how people shopped and saved their money. When currencies move quickly, everyday decisions, from buying groceries to planning savings, feel the impact.

Global market shocks, like the 2008 financial crisis or the 2020 oil price war, remind us that outside events can send ripples through economies everywhere. These shocks can upset trade balances and alter currency values, which may put pressure on local businesses and international trade. When crises hit, both governments and companies often need to reevaluate their strategies, highlighting weak spots in our interconnected financial world.

img-3.jpg

When the job market faces sudden shocks, the changes become striking. In 2009, the U.S. saw unemployment hit about 10%. This was a tough time for many families and local businesses as the economy took a hard hit. In 2013, the euro area had a big rise in youth unemployment, showing how hard it can be for new workers to find steady jobs. And then in 2020, the COVID-19 crisis led to many sudden layoffs and short-term jobs, reminding us how unpredictable things can be in a crisis.

Wage trends add another important side to the story. In India, after the government opened up the market in the mid-1990s, folks started to see gradual improvements in their pay. This change reflected new economic policies and more job opportunities. Similarly, in 2015 the U.K. raised the minimum wage, which helped lower-income workers earn more. This change brought more confidence to many households and shifted how income was spread across society.

Overall, shifts in unemployment and wages affect how much money people spend. When earnings rise or job stability increases, it can boost consumer spending and support social programs.

Final Words

in the action, this article broke down clear macro economic examples that show how GDP growth, inflation, and unemployment work in everyday events. We talked about fiscal tweaks, monetary shifts, business cycles, global trade steps, and labor trends. These real-world examples help make sense of how policy moves and market changes affect our wallets. Every example adds vital pieces to the overall picture of economic health. Keep this insight handy as you make smart moves for a stronger financial future.

FAQ

What is the meaning of macroeconomics?

The macroeconomic meaning covers broad economic measures like GDP, inflation, and unemployment. It explains how an entire economy functions and helps shape policy decisions and business strategies.

What are some real-life examples of macroeconomics?

Real-life examples of macroeconomics include GDP rebounds after recessions, consumer-price inflation surges, and rising or falling unemployment rates. These cases illustrate overall economic health and influence government policies.

What types and examples of macroeconomics exist?

Examples include government spending effects, monetary policy changes, business cycle phases, labor market trends, and international trade dynamics. These demonstrate various angles from which economists analyze the big picture.

What macroeconomic factors affect business?

The macroeconomic factors affecting business consist of interest rate changes, inflation trends, overall economic growth, unemployment fluctuations, and shifts in global trade, all of which influence market conditions and investment decisions.

How important is macroeconomics for understanding the economy?

Macroeconomics is crucial as it reveals overall economic trends and risks. It helps businesses, governments, and individuals make informed decisions by providing insight into major indicators such as GDP, inflation, and unemployment.

How does microeconomics differ from macroeconomics?

The answer highlights that microeconomics focuses on individual markets and consumer choices, while macroeconomics examines large-scale economic trends like inflation, GDP growth, and employment patterns.

What are some related fields to macroeconomics?

Related fields include microeconomics, econometrics, international economics, and statistics. Each provides tools to study different aspects of the economy, from individual decisions to global market trends.

What are the five key macroeconomic indicators?

The five key indicators usually include GDP, inflation, unemployment, interest rates, and fiscal balance. These metrics together offer a comprehensive snapshot of a nation’s economic condition.

What are the three main types of macroeconomic approaches?

The three main approaches typically include classical, Keynesian, and monetarist macroeconomics. Each provides distinct insights on how economies cycle and respond to policy changes.

Mobile Payments Services: Enjoy Smart Payment Options

0

Have you ever noticed how your phone is becoming your wallet? Mobile payment services let you pay quickly and securely without needing cash or cards. They turn your phone into a handy digital cash box, ready to use wherever you go. More people are choosing this method for everyday purchases, which makes checking out smoother and safer. In this article, we break down how mobile payments work and why they are changing the way you manage your money each day.

Mobile Payments Services: Enjoy Smart Payment Options

Mobile payment services let you use your smartphone or wearable device to pay, instead of carrying cash or cards. This method is popular around the globe, especially with younger folks, because it’s fast and safe. It’s like having a digital wallet in your pocket that works anytime, anywhere.

These services use NFC (Near Field Communication, which is a short-range way to transfer data) and QR codes to complete transactions quickly and securely. For example, when you tap your phone at a store, NFC sends secure, scrambled payment details, keeping your information private. Likewise, scanning a QR code lets you pay in just a few taps, making your in-store shopping experience fast and hassle-free.

  • Mobile wallets
  • Peer-to-peer apps
  • Mobile e-commerce (m-commerce)
  • Mobile point-of-sale (mPOS)
  • SMS and carrier billing

Both businesses and consumers are choosing these smart payment options because they make buying simple. Companies cut costs by using less cash and card systems, while customers enjoy fewer steps at checkout with extra security and privacy. This modern method not only makes paying easier, it also keeps transactions smooth when you’re on the go.

Comparing Top Digital Wallet Platforms and Smartphone Transaction Apps

img-1.jpg

Digital wallet platforms and smartphone payment apps let you pay quickly and securely right from your phone. Big names like Apple Pay, Google Pay, Samsung Pay, PayPal, and Venmo each bring their own set of features to fit different needs. For example, Apple Pay and Google Pay use NFC (a simple way to send data over a short range without wires) so you can tap your phone to pay in stores or catch transit passes. Meanwhile, Samsung Pay mixes NFC with a method called magnetic secure transmission (MST) to work at more traditional payment spots, giving you extra flexibility. And then there’s PayPal and Venmo, which focus on online transactions and person-to-person transfers, adding strong buyer protection and fun social features for splitting bills among friends.

Provider Technology Coverage Fees
Apple Pay NFC 90+ countries 0.15%–0.25%
Google Pay NFC, QR 79 countries 0.5% per txn
Samsung Pay NFC, MST 20+ countries 0.3%–0.5%
PayPal Online/API 200+ markets 2.9% + $0.30
Venmo Online/P2P US only 1% for instant

If you’re all-in on iOS, Apple Pay is a smooth choice with its simple tap-to-pay method. Google Pay works well for many users around the world by combining NFC and QR codes. Samsung Pay stands out if you want to pay anywhere, thanks to its MST feature that lets you use older payment machines. And if you’re shopping online or sending money to someone quickly, PayPal offers a trusted global solution while Venmo makes everyday money transfers among friends feel social and easy.

Ensuring Secure Digital Transactions in Mobile Payments Services

Mobile payments use smart security tools to keep your payment information safe. They replace your real card numbers with unique digital codes, so your actual details never show up on your phone. It’s like using a secret language that keeps hackers out. With mobile wallets, your raw card data never sits on your device, which means there's much less risk of theft. For instance, when you tap to pay, your phone sends a one-time code instead of your real card number.

On top of that, these systems use your fingerprint or face to verify that it's really you making a transaction. This extra check makes sure that only you can approve any purchase, even if your phone goes missing. It’s a simple way to stay secure, giving you peace of mind.

Plus, there’s a system in place that watches every transaction in real time, ready to flag anything unusual right away.

Analyzing Transaction Fee Structures and Costs in Mobile Payment Services

img-2.jpg

When you use mobile payment services, you often see fees of 1.5% to 3% for credit card transactions, while debit transactions come with a simple flat fee. This means that for every sale you make, a small cost is taken out, so it's important to plan for these fees.

Besides these percentage-based fees, some providers may add extra costs like monthly charges or rental fees for card readers. For example, if you use a mobile reader to accept payments, you might have to pay a steady monthly fee for the technology behind wireless transactions. Bundled service packages and lower interchange rates (the fee paid to process the payment) can help reduce the overall expense, making these modern solutions a strong alternative to traditional payment systems.

These days, mobile payment methods can save businesses money compared to older payment terminals. Lower processing fees and flexible monthly plans mean merchants can cut costs while still offering a fast, smooth checkout that customers really appreciate.

Integrating Mobile Payments Services into Business and E-commerce Platforms

Mobile point-of-sale devices let businesses take payments almost anywhere. They work by connecting to a smartphone via Bluetooth or a headphone jack, so even little pop-up shops can process transactions without needing heavy, stationary systems. This setup makes in-person sales a breeze, letting shop owners serve customers quickly wherever they are.

Online stores boost their checkout process by adding payment tools, like SDKs or plugins, to platforms such as Shopify and WooCommerce. This means merchants can let customers pay with digital wallets with just one tap. And with built-in finance solutions, money flows easily, making the whole payment process smoother.

Plus, using invoice generators and budgeting tools to sync transactions with accounting software cuts down on manual work. This smart integration automates the back office, helping merchants keep a close eye on expenses and revenue with great accuracy and ease.

Exploring Peer-to-Peer Transfer Tools and International Remittance Technology

img-3.jpg

Domestic peer-to-peer tools have completely changed the way we send money to friends and family. Apps such as Venmo, PayPal, and Zelle let you send funds directly from your linked bank account or card. With just a few taps, you can split a dinner bill or quickly repay a friend. These apps are designed to be easy to use, showing you clear records of every transaction so that everyday money exchanges are both smooth and secure. They’re especially handy for anyone who wants to transfer cash fast, without the usual delays of traditional banks.

When it comes to sending money across borders, international remittance technology works in a similar way. These services rely on smart currency engines and strong compliance checks to automatically handle currency exchanges. You can send money overseas at good rates and pay lower fees compared to old-school services. Plus, they show you clear exchange rates and manage all the necessary rules, so you can feel confident that your international transfers are both reliable and efficient.

Contactless biometric payments and voice-activated transactions are opening new doors in how we pay for things. Instead of typing a PIN, you simply let your fingerprint or face confirm the payment. Imagine saying "Pay now!" and watching the transaction go through almost instantly.

At the same time, experts are exploring blockchain-based systems that create digital ledgers. These ledgers store records in a safe, decentralized way using special digital tokens instead of traditional money details. In other words, this technology could lead to faster and more reliable payments between people.

Smart technology is also on the rise to spot any unusual activity. AI-powered fraud detection and machine learning check every payment in real time, just like a watchful security guard noticing a stranger. And where NFC (a way to pay by tapping your device) isn’t common, QR-code wallets let you pay simply by scanning a printed code, keeping the process quick and easy.

Final Words

In the action, this post covered the essence of mobile payments services, from everyday smartphone transactions to the robust security measures keeping payments safe. It recalled how NFC, QR codes, and digital wallets power secure trades and cutting-edge innovations. We saw how businesses integrate these tools to boost online and in-person sales while embracing streamlined fee structures and peer-to-peer transfers. Exciting trends like biometric methods and blockchain innovations offer bright prospects for smart, secure financial choices. Keep moving forward with confidence in these evolving solutions.

FAQ

How can I get the phone number for a mobile payments service?

The mobile payments service phone number information depends on the provider. You should visit the official website of each service to find contact details and customer support numbers.

What are examples of mobile payments services?

The mobile payments service examples include Google Pay, Apple Pay, Samsung Pay, PayPal, and Venmo. They allow users to make quick and secure payments using their smartphones.

What is considered the best mobile payment service?

The best mobile payment service varies by user needs. Top choices like Apple Pay and Google Pay offer ease-of-use, strong security measures, and widespread acceptance across many retailers.

What is Google Pay?

The Google Pay mobile payment service enables users to store cards and make contactless payments using NFC and QR code technologies, making transactions swift and secure in many countries.

What are the three main types of mobile payments?

The three types of mobile payments include mobile wallets for storing cards, peer-to-peer apps for direct transfers, and mobile point-of-sale systems for in-person payments using smartphones.

What is the cheapest way to accept card payments?

The cheapest way to accept card payments often involves using mobile payment apps with low transaction fees, which are designed to offer competitive rates for small business transactions.

Emerging Financial Trends Spark Promising Growth

Ever wondered if big changes in money matters could fatten your wallet? New tech like AI (that smart computer learning), blockchain (a digital record system), and systems that work on their own are creating fresh opportunities.

Across the globe, people are shifting to smarter money moves. Banks are also getting in on the game, using digital tools to work more efficiently.

These shifts are shaking up old ways and opening the door to surprising, new opportunities. In this article, we’ll take a friendly look at how these trends might change everyday money matters for you.

The financial world is shifting fast. Global conflicts, political changes, and climate challenges are pushing banks and other money managers to rethink their methods. To stay on top, many are turning to digital tools like AI, automation, and blockchain (a secure digital ledger).

Market forecasts are showing some promising numbers. For instance, embedded finance, where financial services are built into everyday products, is expected to hit about $384.8 billion by 2029 with a growth rate of 30 percent. Meanwhile, the financial wellness sector might reach $1.21 billion by then, growing around 13 percent. These figures point to a steady, gradual evolution in how finance works.

Small business leaders are catching on to technology too. Nearly eight in ten now rely on cloud-based accounting systems to manage budgets and ease cash flow issues, a common challenge for many. This move toward digital solutions means companies are better equipped to handle fast-changing market demands, creating both challenges and new opportunities.

Overall, these trends are nudging the entire finance industry to become more resilient and adaptable. As technology reshapes how businesses operate, everyone from large firms to small businesses is finding ways to meet future customer expectations while staying ahead of the curve.

Digital Transformation, AI, and Process Automation in Financial Services

img-1.jpg

Financial companies are leaning more on AI and machine learning to make everyday tasks run smoother. They now pass on jobs like entering data, checking for rule compliance, and processing transactions to robotic process automation (RPA). RPA is a way to use technology to handle routine tasks, and it can cut errors by about 70 percent and even halve processing times. Most small and medium businesses now rely on cloud-based accounting tools with built-in automation to manage their daily finances.

Predictive analytics also plays a big role in this digital shift. It helps spot fraud and supports smart chatbots that handle customer questions. Tools like these change simple tasks into clear and efficient processes. This tech upgrade not only saves time and money but also frees up staff to focus on bigger decisions.

Here are five key ways AI and automation are changing financial work:

  • Automating data entry tasks
  • Improving compliance checks with machine learning
  • Speeding up transaction processing with RPA
  • Enhancing fraud detection using predictive analytics
  • Powering chatbots for better customer service

New rules in finance are changing how blockchain is used and making everything more open and simple. These updates are boosting transparency in areas like asset management, payments, and settlements. Big financial institutions are using these advances to reduce costs and make transactions smoother. And think about smart contracts – these self-executing agreements cut out extra fees by about 30% and speed up settlements. It’s all about creating a more effective system that benefits everyone.

Across Europe and Asia, central banks are trying out digital currencies. These tests push institutions to explore digital money that has built-in safety and follows current regulations. Companies are experimenting with these currencies to help speed up payments and record-keeping automatically. This progress is paving the way for digital money to work hand in hand with other financial tools. It’s a mix of new technology and updated rules that is setting a strong foundation for the future.

Tokenization is unlocking fresh opportunities for both investors and issuers. By converting physical assets like real estate, art, and private equity into digital tokens, investors can own smaller pieces of valuable items. This means increased liquidity and easier trading of assets that once needed huge amounts of money to buy. Decentralized finance, as mentioned in the link to decentralized finance, plays a crucial role in supporting these tokenized assets and ensuring smooth transactions. In short, tokenization is bridging traditional markets with digital opportunities, making asset ownership more flexible and accessible.

Use Case Industry Example Main Benefit
Smart Contracts Insurance Faster settlements and lower costs
Digital Currency Evolution Central Banks Improved transparency and efficient payments
Asset Tokenization Real Estate Investment Fractional ownership and enhanced liquidity

Embedded Finance, Neobank Growth, and FinTech Integration Approaches

img-2.jpg

Embedded finance is booming. Experts predict this market could hit around $384.8 billion by 2029, growing at a rate of 30 percent each year. Many nonfinancial companies are now offering banking services right within the apps and websites you already use, making transactions smoother and more enjoyable.

This change is coming from many different forces. Fintech tools are making it easier for companies to add financial features directly to their digital platforms. Digital neobanks are also on the rise, now serving about 20 percent of retail banking users in major markets. They are popular because they offer zero-fee accounts and a strong focus on mobile banking. In fact, mobile wallet transactions made up 45 percent of digital payments in 2024, showing just how much everyday banking is evolving.

Rules and regulations are helping shape this new landscape as well. Open banking APIs let secure data be shared with trusted third parties (with the customer’s permission). This setup not only sparks new financial products but also keeps data safe while encouraging more competitive services.

At the end of the day, the customer experience is key. Neobanks and embedded finance services offer real-time updates, faster service delivery, and simpler account management. Many startups are combining smart technology with a focus on the customer, making it easier to find financial products that truly match individual needs.

Cybersecurity Measures and Compliance Automation in Emerging Financial Platforms

Digital threats are growing, so financial platforms are stepping up their game against cyber attacks. These days, institutions face smarter scams and hackers every day. For instance, one bank saw a spike in repeated hacking attempts and quickly moved to use multi-factor authentication. This means that besides a password, users now need an extra check like a one-time code or a fingerprint scan. It’s a simple but important step to keep online transactions safe, because even a small breach can cause big problems.

New ways to confirm who you are are now a key part of online security. Biometric tools, such as fingerprint and facial scans, are becoming popular as a fast and reliable method to prove your identity. A few institutions now require customers to pass a quick facial scan before finishing a transaction. These methods help cut down on fraud and give users a sense of security. Meanwhile, compliance automation is growing to meet new digital threats with the latest tools, all while keeping customer access easy and secure.

RegTech tools, powered by artificial intelligence, are changing the rules for compliance. By automating real-time checks like Know Your Customer (KYC, which is a quick way to verify who you are) and Anti-Money Laundering (AML, steps taken to prevent illegal money activities), these systems can cut review times by 60%. Built-in fraud measures, like machine learning that spots unusual activity, alert banks quickly. With RegTech software expected to increase by 25 percent each year through 2026, financial institutions now have better ways to watch over transactions in our fast-changing digital world.

Leveraging Big Data, Advanced Risk Analytics, and Personalized Services

img-3.jpg

Big data is changing how banks and financial companies make smart choices. By looking at vast amounts of information, these institutions can spot risks, catch fraud, and understand different customer groups. Every day, platforms handle trillions of data points to predict market trends and assess credit risks more accurately. This means companies can quickly adjust to changes, cut down on surprises, and make better decisions.

The benefits are clear. More and more firms are using these innovative tools, and about 80% of data-driven companies see higher profits thanks to smarter planning and streamlined operations. When product recommendations are tailored to each customer's behavior, engagement can jump by 25%. This personalized approach not only builds trust with clients but also helps companies stand out from the competition.

Imagine an investor receiving advice that fits their spending habits perfectly. With detailed data insights, financial advisors can understand spending patterns, risk levels, and new market trends, allowing them to offer advice that really hits the mark. Tools like those mentioned in “Behavioral Finance Trends and Consumer Insights” help companies keep fine-tuning their services. When advanced risk analysis meets personalized customer insights, businesses can prepare for market ups and downs while creating services that truly resonate with each individual, driving both satisfaction and lasting growth.

Algorithmic Trading Breakthroughs, Robo-Advisory Growth, and Wealth Management Innovations

Smart computer programs are changing how trades happen in our financial markets. These breakthroughs let trades occur in a flash, sometimes in less than a thousandth of a second. This speed helps lower costs and makes buying and selling smoother for everyone. Today, many financial firms count on these fast systems to keep the market running efficiently.

Robo-advisors are also making it easier to manage wealth. In 2022, these digital advisors handled almost $1 trillion in assets. Experts believe that number will double by 2025 because of their low fees and advanced tech. With these online services, customers can check their accounts in real time and enjoy quick, friendly support through easy-to-use digital tools.

Additionally, new tools backed by artificial intelligence are reshaping everyday investment decisions. They can automatically balance your portfolio or find ways to lessen your tax bill, a simple way to make the most of your money. Chatbots and mobile alerts now respond instantly to market changes, boosting user interaction by 40%. This makes it simpler for both seasoned investors and beginners to act fast and make smart choices, even without deep financial expertise.

Looking ahead, we can expect even more smart technology to blend algorithmic trading with enhanced online advisory services. These advances promise a future where managing money is easier, smoother, and ready to keep up with a fast-changing market.

Sustainable Finance, ESG Integration, and Green Investment Practices

img-4.jpg

Sustainable finance is growing fast. In 2020, assets with a focus on sustainability hit $35.3 trillion worldwide, and experts expect that number to top $50 trillion by 2025 thanks to ESG rules (which cover environmental, social, and governance standards). Green bonds, for example, raised $1 trillion in 2020 as investors look to support eco-friendly projects while still earning good returns. This trend shows that banks and investors are eager to include sustainable practices in their portfolios.

Different financial tools are fueling this shift. Crowdfunding and peer-to-peer platforms, for instance, helped raise $34 billion in 2021, opening doors to new funding methods. And in 2022, microcredit loans reached $140 billion, giving underserved communities more access to the capital they need. These varied funding models help boost market liquidity (the ease of turning assets into cash) and support social progress.

The social impact of these trends is big. By promoting ESG standards, investors back projects that improve communities and protect the environment. Sustainable finance not only drives profits but also strengthens responsible investing. With more people joining in, eco-friendly and inclusive financial practices are set to continue shaping how capital is put to work in the future.

Final Words

In the action of this article, we covered a range of topics that shape the financial world today. We touched on global shifts, digital innovations, and the role of technology in personal finance.

Each section offered insights into market size, security measures, and even sustainable investing. Exploring emerging financial trends shows that smart adjustments today can help secure better financial security and growth tomorrow.

Stay optimistic, every step you take improves your financial outlook.

FAQ

Q: What does the emerging financial trends pdf cover?

A: The emerging financial trends pdf highlights market shifts, digital transformation, and regulatory changes. It provides insights into automation, AI, cybersecurity, and sustainable finance, offering a clear overview of global financial practice changes.

Q: What financial trends are expected in 2025?

A: The financial trends in 2025 lean toward more digital innovation, expanded automation use, and the rise in embedded finance. These shifts also include regulatory changes and greater push for sustainable, cloud-based services.

Q: What is included in a financial trends analysis?

A: A financial trends analysis reviews growth patterns, technology adoption, market shifts, and risk controls. It covers key indicators such as data-driven strategies, digital platforms, and compliance tools that shape modern financial services.

Q: What are the key financial services trends for 2025?

A: Financial services trends for 2025 center on digital transformation, automation, and increased blockchain use. These trends work to reduce processing times, improve transparency, and offer better customer service through embedded finance.

Q: How are emerging trends changing financial management?

A: Emerging trends in financial management boost digital innovation and automation in areas like budgeting, compliance, and data tracking, enabling financial managers to access real-time insights and streamline everyday money operations.

Q: What are the global financial trends impacting markets?

A: Global financial trends impacting markets include heightened automation, technology-driven risk analytics, and evolving digital currencies. These factors are powered by greater digitization and regulatory changes, all driven by the rise in AI usage.

Q: What is the financial sector outlook for the near future?

A: The financial sector outlook projects growth in embedded services, digital accounts, and cloud platforms. Advances in AI and cybersecurity are reshaping operations and customer services, pointing to a dynamic and efficient market ahead.

Q: What are three current trends in the banking industry?

A: Three current trends in the banking industry are the growth of neobanks with minimal fees, increased use of cloud-based accounting among small businesses, and the rapid expansion of digital payments through mobile wallets.

Sofi Active Investing: Bold And Smart Choice

0

Have you ever thought about trading without the extra fees? SoFi Active Investing lets you buy stocks, options, and ETFs without commission costs, letting your money work harder for you. Whether you're saving for your future or growing everyday investments, every dollar counts. And if you qualify, you can even get a bonus on IRA deposits, with friendly support available when you need it. Could this be the smart, bold move your money has been waiting for?

SoFi Active Investing: Bold and Smart Choice

SoFi Active Investing makes it simple to start trading without worrying about commission fees. You don’t need a large amount of money to open an account, which means you can begin trading right away. Whether you're interested in stocks, options, or ETFs, you get to enjoy zero commission, making every trade count. And here's a cool fact: if you choose to invest in over 6,800 no-transaction-fee mutual, interval, or liquid alternative funds, you’ll never have to fret about extra fees eating into your profits.

The platform supports all kinds of accounts, traditional, Roth, SEP, and rollover IRAs. Plus, with a 1% bonus on qualifying IRA deposits, your retirement savings get a little extra boost. Imagine setting aside your funds and, like magic, watching that extra boost help grow your nest egg faster.

If you ever need help, SoFi is there for you with email, chat, and phone support Monday through Friday, 8 a.m. to 8 p.m. ET. Just remember that while you won’t see commission fees, the orders might go through a payment process called payment for order flow. In simple terms, that means the final trading price might be influenced by this method.

SoFi Active Investing Fees Breakdown and Pricing

img-1.jpg

SoFi Active Investing uses a simple fee model that charges zero commissions for stocks, ETFs, and options trades. This means you get to buy and sell without any surprise fees. Even for options contracts, there's no fee per contract, so you always know exactly what you're paying. It’s designed so you can focus on your investment goals rather than worry about extra charges. Just imagine placing a trade and seeing no fees taken out, your money stays where it needs to be.

Fee Type Rate Details
Equities & ETFs $0 No commission
Options Contracts $0 No per-contract charge
Uninvested Cash 0.01% Must opt in; lower than competitor rates
IRA Deposit Match 1% On qualifying IRA contributions
Order Routing Payment for Order Flow May affect execution price

Compared to many traditional brokerages that charge per trade or robo-advisors that take a small percentage of your assets, SoFi’s approach is refreshingly clear. Sure, some competitors might offer a bit more interest on your idle cash, but the real benefit here is the zero-commission system, which helps you keep more of your money from the start.

Setting Up and Navigating SoFi Active Investing

Getting started with SoFi Active Investing is really simple. There’s no minimum amount needed, so you can start with a clean slate. You can sign up on the SoFi website or use their mobile app, it only takes about 10 minutes. First, you verify your identity with a few easy steps, then link your bank account, and finally set your investment preferences. After that, you create a secure login with your email and a two-step authentication code. This easy process means you can start investing without any fuss.

Once your account is up and running, the SoFi mobile app makes managing your investments a breeze. The dashboard shows your portfolio clearly, and a trade ticket screen lets you buy or sell quickly. You also get useful features like watchlists and a research tab to keep up with market trends and news. Plus, if you ever run into a problem or have a question, customer support is available Monday through Friday from 8 a.m. to 8 p.m. ET. Helpful tips pop up during each step to ensure everything goes smoothly. It really gives you a sense of ease.

Features and Investment Options in SoFi Active Investing

img-2.jpg

SoFi Active Investing gives you a simple way to build a strong, varied portfolio. You can invest in U.S. and international stocks, pick ETFs (which are like easy bundles of different stocks), and choose from 6,800 mutual funds with no extra fees. It’s like gathering the perfect mix of ingredients to create your favorite meal, letting you zero in on your financial goals without worrying about added costs.

Interval and Alternative Funds

If you’re looking to add a twist to your usual stock picks, check out interval funds and liquid alternative funds. These options bring in assets that don’t always move with the crowd. With interval funds, you can access your money at set times, though they might not be as quick to cash out as everyday stocks or ETFs. On the other hand, liquid alternative funds try to give you extra variety while keeping things a bit more flexible.

Cryptocurrency Trading

Besides regular investments, SoFi Active Investing also lets you dip into the world of cryptocurrencies. Through SoFi Invest, you can trade popular coins like Bitcoin (BTC), Ethereum (ETH), Litecoin (LTC), and Bitcoin Cash (BCH). This means you can add digital assets to your mix without juggling different platforms or confusing fees.

Plus, the platform helps you save for retirement with options like traditional, Roth, SEP, and rollover IRAs, all backed by a 1% match on eligible contributions. It’s a neat way to boost your retirement savings while staying on track with your investment strategy.

Comparing SoFi Active Investing with Passive and Automated Strategies

SoFi Active Investing is a great option if you like to manage your own investments and avoid extra fees. With SoFi, you don’t pay any commissions on trades, while most robo-advisors charge around 0.25% to 0.50% of the money you invest. This means active investors can focus on picking stocks rather than worrying about fees. Robo-advisors use computer programs to make trades, and sometimes the results can vary, while traditional brokers might add fees to each trade. Plus, how each platform deals with cash is different. SoFi pays a very low 0.01% interest on uninvested cash, although some competitors might offer a higher rate. Even though SoFi gives you quick access to basic market quotes and news, larger brokers and more advanced robo-advisors may provide deeper market insights and goal-based planning.

Feature SoFi Active Investing Robo-Advisor Traditional Broker
Commission $0 0.25–0.50% AUM $0–$5 per trade
Cash Interest 0.01% Typically none Up to 4%
Research Tools Basic quotes & news Goal-based planning Advanced analytics
IRA Match 1% 0% Varies

If you enjoy managing your investments yourself and want to sidestep hidden fees, SoFi Active Investing might be for you. Every trade helps build your portfolio without extra charges, which is key for investors who want a hands-on approach. On the other hand, if you’d rather set up your portfolio and let it run automatically, robo-advisors might be a better fit since they offer automated, goal-focused planning. And if you rely on a lot of detailed market data and advanced trading options, then a traditional broker could be the right choice.

Each option has its ups and downs, so the best one really comes down to how you like to invest and what your financial goals are.

Performance Metrics and Risk Management in SoFi Active Investing

img-3.jpg

With SoFi's Active Investing, you get a live look at your portfolio right in the app. The dashboard shows clear, real-time updates so you can see your gains and adjust your strategy as you go. It really feels like you’re keeping your finger on the pulse of your investments.

  • Limit orders let you set a top price when buying or a bottom price when selling.
  • Stop-loss orders help protect you from sharp drops in value.
  • Diversification spreads out risk by including different types of assets.
  • Interval funds offer investments that can only be redeemed at set periods.
  • Alternative funds add non-traditional assets to your portfolio.

Even though low fees are a big perk, they come with a twist called payment for order flow. This means that while your commissions are lower, the trade price might be affected. Always mix and match these tools wisely so that low fees don’t end up slowing down your trade execution.

Best Practices and Strategies for SoFi Active Investing Beginners

SoFi Active Investing gives you a simple, low-cost way to start with no minimum account balance, zero commission trades, and even a 1% IRA match. Beyond these basics, there are some clever strategies and expert tips that can make a big difference.

Start by setting clear, advanced investment goals based on what the market is doing. For example, you might decide to change your risk level when market signals are shifting fast, just as a seasoned investor would plan ahead before a major change.

Be smart with limit orders when the market gets choppy. One expert mentioned that placing a limit order during a sudden market drop helped limit losses from unforeseen dips. It’s a practical tool to manage risk in unstable times.

Don’t put all your eggs in one basket. Spread your investments across ETFs and mutual funds, keeping an eye on how specific sectors perform. A real-life case study showed that pairing technology ETFs with consumer staples can help balance returns when one area isn’t doing as well.

Consider adding interval or alternative funds to your mix. Some investors turn to these funds during quieter market periods, almost like setting aside a cushion to help smooth out the ups and downs.

Keep an eye on any cash you have sitting idle. Even a little bit of ignored cash can work for you if you opt to earn interest on it. An investment coach once pointed out how putting unused cash to work can give your portfolio a slow, steady boost over time.

Finally, keep learning by joining webinars and community forums. There, experts share insights and you get to hear detailed case studies that might not be covered in basic lessons. One webinar even showed how fresh insights could help rebalance a portfolio in real time.

Regularly review your portfolio and tweak your strategies as market conditions change, always leaning on expert advice to guide you along the way.

Pros and Cons Analysis of SoFi Active Investing

img-4.jpg

We’ve already talked about some of the main points. Here’s a simple guide comparing SoFi Active Investing with similar platforms.

Pros:

  • No fees when you trade
  • No minimum balance required
  • A wide range of choices like stocks, ETFs, and mutual funds
  • A 1% match on qualifying IRA contributions
  • A mobile app that makes managing your account easy

Cons:

  • Uninvested cash earns just 0.01% interest, which can lower your returns
  • Payment for order flow might change your trade prices
  • Fewer research tools than some other platforms
  • Basic data analysis compared to bigger brokers
  • Order routing might cause some price differences

If you like low-cost trading and a simple setup, SoFi Active Investing could be a good match. But if you need more detailed research, you might want to explore other options like Brokerage Reviews.

SoFi is quietly rolling out fresh features that hint at bigger plans for active investing. They’ve been introducing updates like higher yields on uninvested cash, clearer research tools that give you an easy snapshot of the market, and new order types that put more control in your hands. They’re also planning API access and deeper cryptocurrency integration to boost the platform’s flexibility. One expert even said that upgrading research tools can really level the playing field, showing how small changes can lead to big improvements.

Fintech trends are also playing a big part in these new developments. Investors today are looking for a mix of active trading and smart automation, which means blending hands-on decision-making with low fees and modern tech. This blend is part of a growing trend that reshapes how we think about investing.

Looking ahead, SoFi could keep expanding its active investing options by adding more advanced tools. They aim to match the ever-changing needs of modern investors with a robust set of features. It’s an exciting move that could bring even more smart, accessible solutions to your investment journey.

Final Words

in the action, this article walked through the details of the SoFi active investing platform. We touched on zero-commission trading, easy account setup, clear fee structures, and a range of investment options with a 1% IRA match. Breaking down risk management and comparing active with other methods helped shine a light on its benefits and tradeoffs.

Every step brings you closer to making smart choices. Embrace sofi active investing and feel confident about your growing financial security.

FAQ

What do Reddit users say about SoFi Active Investing?

Reddit users often praise SoFi Active Investing for its zero-commission trades and easy account setup. They mention that while basic research tools work fine for starters, some wish for more detailed analysis.

How do reviews and beginner experiences rate SoFi Active Investing?

Reviews and beginner feedback highlight its user-friendly interface and $0 minimum requirement. Many find it a solid starting point that makes investing simple, though a few note the limited in-platform research options.

How does SoFi Active Investing make money?

SoFi Active Investing earns revenue through payment for order flow. This means third parties sometimes pay for routing orders, which can affect trade execution—but trading remains commission-free for you.

How does SoFi Active Investing login work?

SoFi Active Investing login is straightforward. You sign in using your email and two-factor authentication via the app or website, which keeps your account secure and easily accessible.

What features does the SoFi Invest app offer?

The SoFi Invest app is designed with simplicity in mind, allowing you to trade stocks, track your portfolio, and quickly check market updates while on the move with a clean and clear interface.

How does investing with SoFi compare to using Fidelity?

SoFi targets users who want fee-free trading and an uncomplicated setup, while Fidelity offers more advanced research tools and data for investors who need in-depth market analysis and robust features.

What is SoFi Active Investing?

SoFi Active Investing is a brokerage platform that provides commission-free trades for stocks, ETFs, and options with no account minimum, making it an accessible tool to start building your portfolio.

Why might I not be able to withdraw cash from SoFi Invest?

Withdrawal issues can occur if funds are tied up in pending trades or if a processing hold is applied to uninvested cash. Reaching out to customer support helps clarify and resolve these situations.

How does SoFi Active Investing compare with competitors like Charles Schwab or Webull?

SoFi sets itself apart by offering zero commissions and low entry costs. While other brokers might have higher cash yields or more research features, SoFi is built to provide a straightforward, beginner-friendly trading experience.

Is SoFi Active Investing good for beginners?

SoFi Active Investing is well-suited for beginners thanks to its $0 minimum investment and commission-free trading. Its streamlined tools help you start investing without facing high fees or overwhelming complexity.

Equity Risk Premium Empowers Smart Investment Decisions

0

Ever wonder if your stocks are really giving you that extra reward for taking a risk? When you pick riskier stocks instead of safe ones like government bonds, you usually expect a little bonus return. We call this extra bump the equity risk premium. It’s like a reward for stepping into riskier territory.

In this post, we break down what the equity risk premium means and how it can help you plan smarter moves. By understanding this simple concept, you can feel more confident in your investment decisions and build a plan that suits your goals.

Understanding the Equity Risk Premium and Its Significance

When you invest in stocks, you’re usually hoping for a bit more return than you’d get from a very safe asset like government bonds. That extra return is called the equity risk premium, or ERP, you can think of it as the bonus you get for taking on more risk. For example, if stocks earn you 10% and a government bond gives you about 4.407%, then the ERP is roughly 5.59%. In simple terms, that’s the extra reward for stepping into riskier territory.

This figure is a big deal when it comes to planning your investments. It helps predict potential future returns and makes it easier to choose strategies that fit how much risk you’re comfortable with. Retail investors, for instance, look at the ERP to decide if the higher return from stocks is worth the extra risk compared to the stability of safer investments. A high ERP means investors expect a larger reward for the added uncertainty, while a low or negative ERP may suggest that even risk-free investments could beat stocks.

In essence, the ERP is a key factor in managing your portfolio, setting asset prices, and balancing risk against reward. It gives you clear, objective information so you can fine-tune your investments. Over time, historical data has shown that stocks generally outpace safe investments, offering a consistent reward for those willing to handle the risk.

Equity risk premium Empowers Smart Investment Decisions

img-1.jpg

Knowing how to work out the equity risk premium is key to making smarter investment moves. You can use simple formulas or more advanced, forward-looking models. Each method helps you uncover the extra reward you could earn for taking on more risk. Below is a table that explains five popular ways to calculate the ERP.

Formula Name Description Components
Basic ERP Formula This method finds the ERP by subtracting the risk-free rate from the market return. For instance, if the S&P 500 returns 10% and the 10-year Treasury yield is 4.407%, you get an ERP of about 5.59%. S&P 500 return, 10-year Treasury yield
Historical ERP This approach uses long-term averages, like a century-long S&P 500 return of around 10%, and then subtracts today’s risk-free rate. Historical market return, Treasury yield
Implied ERP This forward-looking method derives a premium from the current market price, bond yields, and dividend forecasts. Market price, yield data, dividend predictions
Negative ERP This happens when, in a downturn, the expected return on stocks is lower than the risk-free rate, which shows high uncertainty. Expected market return, stable risk-free rate
Supply-side ERP This calculation adds factors like a company’s cost of capital and how much investment capital is around to set the required returns. Corporate finance indicators, available capital metrics

Each method offers a different perspective. For example, the implied ERP is handy when market conditions change quickly, while the historical approach leans on long-term trends. Understanding these formulas helps you compare estimates and choose the one that matches your risk and reward expectations. Smart decisions start with a clear picture of the extra return you deserve for taking on extra market risks.

For more than a hundred years, the S&P 500 has given investors a yearly return of about 10%. If you take the return from a safe asset like the 10-year Treasury note, think of it as a very secure government loan, you end up with an extra return of roughly 5.6%. This extra boost isn’t fixed; it changes with the ups and downs of the economy. In strong market times, it tends to be at the higher end, but during tougher periods, it can drop below 5%.

Looking back over the past 70 years, this extra return has moved between about 4% and 7%. When policy changes or a cautious mood grip investors, they often shift to safe bonds, and the premium drops. But when confidence builds and the economy grows, that extra return rises as investors are rewarded for taking on more risk.

Historical charts make it easy to see that big events like changes in government spending or shifts in global trade have matched up with these swings. These trends give investors a clear view of risk versus reward over time, helping compare today’s market with what has happened in the past.

Key Factors Influencing the Equity Risk Premium

img-2.jpg

The Equity Risk Premium is the extra return investors expect to earn when they take on more risk compared to a very safe investment like a 10-year Treasury note. Although nothing is completely without risk, this risk-free rate gives us a starting point. Think of it as putting money in a highly secure safe deposit box that still earns a little extra interest because it’s backed by the government.

Economic factors such as the overall growth of the economy (GDP), rising prices (inflation), and changes in central bank policies also shape this risk premium. When the economy shifts, investors adjust their expectations. They might ask for more reward during uncertain times or less when things seem steady, because these factors hint at how future earnings could change.

Then there’s the impact of market ups and downs. When the market gets unpredictable or an asset moves more sharply than the rest, investors tend to demand a higher return for taking those risks. In rough economic times, aspects like wider spreads in credit risk can further push the premium higher, showing just how careful investors need to be in balancing risk and reward.

Equity Risk Premium in Financial Models: CAPM and Dividend Growth Approaches

CAPM-based ERP Estimation

The CAPM method is pretty straightforward. You simply calculate the cost of equity by adding the risk-free rate to the product of beta and the equity risk premium. Beta tells you how much a stock tends to move compared to the overall market. For example, if a stock has a beta of 1.3, you can expect its movement to be about 30% greater than the market’s swing. This approach gives you a clear picture of the extra return investors look for when they take on market risk. So, if the risk-free rate is low but the beta is high, it means investors need a larger reward to handle the bumps along the market road.

Dividend Growth Model for ERP

The Dividend Growth Model takes a different angle. Instead of just looking at historical market moves, it figures out the implied equity risk premium by comparing a stock’s current price to its expected dividend yield along with its long-term growth rate. In simple terms, it asks, “What kind of growth is needed so that today’s dividend cash aligns with the stock’s market price?” For instance, if a company consistently pays dividends and is expected to grow steadily, this model helps uncover the extra return over the risk-free rate that investors are likely to demand. Each method has its own benefits, and choosing one really depends on whether you’re more tuned in to today’s market mood or a company’s long-run dividend journey.

Practical Applications of Equity Risk Premium in Portfolio Management

img-3.jpg

The equity risk premium isn’t just a number on paper, it’s a handy guide that tells you how much extra return you can expect for taking on a bit more risk. It lets you see if a higher return from an asset is truly worth the added risk. Even if you aren’t a professional investor, you can use this idea to help balance risk and reward in your own investments.

Think of using the equity risk premium like setting a target for your savings goals. You might use it when figuring out the cost of capital for a project or when adjusting the mix of investments in your portfolio. As market conditions change, the ERP shifts too, and that might mean it’s time to tweak your strategy. Investors often use it to check that their returns match what the market is doing or to compare their performance with common market benchmarks.

Some practical ways to use the equity risk premium include:

  • Setting return targets for smart asset allocation.
  • Comparing different asset classes with risk-adjusted measures.
  • Calculating the cost-of-capital for projects and investments.
  • Adjusting portfolio weights when market premiums shift.
  • Checking your investment results to make sure they line up with market trends.
  • Using tools like Equity Research and methods found at Portfolio Analysis.

Each of these steps turns the equity risk premium from an abstract number into a clear, actionable strategy for managing your money.

Global Perspectives on Equity Risk Premium

When you look at markets around the world, you’ll notice that the extra return investors expect for taking on risk, the Equity Risk Premium or ERP, can differ a lot. Developed markets usually offer steadier and lower premiums because their economies are strong and governments are stable. But in emerging markets, stocks tend to jump around more. For example, in an emerging economy, investors might need an extra 8% or more to make up for risks like political changes and unstable currencies. It’s a clear sign that less established markets demand higher rewards for the extra risk.

During tough economic times, you might even see negative ERPs in regions like Europe and Asia. This means that stocks could yield less than risk-free investments when uncertainty is off the charts. To handle this, investors often tweak their calculations with country-specific adjustments. They add something called a sovereign spread, a small extra percentage added to account for local political and fiscal risks, before comparing these markets to global benchmarks.

Comparing the ERP across different regions helps investors understand how much extra return they should expect based on where they put their money. Emerging markets come with bigger ups and downs, so the required premium is higher, ensuring that the additional risks are properly rewarded. In more stable, developed markets, the premiums tend to be lower but steady, reflecting a more secure investment base.

Final Words

In the action of breaking down market trends, we explored how the extra return from stocks versus government bonds shows up as the equity risk premium. We touched on the math behind it, historical trends, key economic triggers, and popular models like CAPM and Dividend Growth. We also saw how this measure guides portfolio choices and signals opportunities in different markets. This clear look at the equity risk premium leaves you with a practical sense of making smarter money choices.

FAQ

What is the equity risk premium formula?

The equity risk premium formula equals the market return minus the risk-free rate, showing the extra gain investors expect from stocks over government bonds.

What does the equity risk premium chart show?

The equity risk premium chart shows historical trends and fluctuations, allowing investors to see how market returns have outpaced risk-free rates over time.

How does Damodaran approach equity risk premium estimation?

Damodaran estimates equity risk premium by using forward-looking models that combine dividend forecasts, bond yields, and current market prices.

What is the current equity risk premium on the S&P 500?

The current equity risk premium on the S&P 500 reflects the extra return above government bond yields, generally averaging around 5% to 6% based on recent analyses.

How do equity risk premium and market risk premium differ?

The equity risk premium describes the extra return on stocks over government bonds, while the market risk premium compares overall market returns against the risk-free rate.

How can one estimate the equity risk premium?

One can estimate the equity risk premium by using historical averages or implied methods that incorporate current stock prices, dividend yields, and prevailing risk-free rates.

What does it mean when the equity risk premium is 0?

A zero equity risk premium means that expected returns from stocks are equal to the risk-free rate, implying no additional reward for taking on market risk.

Is a higher or lower equity risk premium better?

A higher equity risk premium suggests a bigger reward for risk, but it might also signal market uncertainty, while a lower premium indicates reduced extra return but less perceived risk.

What does “equity risk premium 2025” refer to?

“Equity risk premium 2025” refers to forecasts estimating future extra returns from stocks over bonds, which depend on evolving market conditions and economic forecasts.

Where can I find equity risk premium data and PwC insights?

Equity risk premium data is available from academic research and financial reports, and PwC insights often include detailed analyses to help investors understand risk and return dynamics.

What Is Digital Banking: Clear, Smart & Modern

0

Ever thought managing your money could be as easy as tapping your phone? With digital banking, you can check your account balance, pay your bills, and transfer money anytime, anywhere. No more waiting in long lines or being bound by strict hours.

This modern way of banking uses secure platforms and automated processes that save you time. In this post, we explain how it all works in simple steps, from keeping your money safe to enjoying quick access whenever you need it.

By looking at its key features and benefits, you’ll see why digital banking is a smart, secure, and convenient choice for your everyday finances.

Digital Banking Defined: What It Means, Key Features, and Benefits

Digital banking is a way to handle your banking online. It completely changes the old method by letting you use apps and websites anytime you need. You can check your accounts, pay your bills, transfer money, and all of this is done securely under one digital setup.

Traditional banking meant walking into a branch and waiting in a long line. Now, with digital banking, you can skip that trip and manage your money whenever and wherever you want. It replaces waiting and strict hours with instant access and easy, automated processes that make your everyday finances simpler.

• Access your account anytime through secure mobile apps and websites.
• Open your account quickly with built-in identity checks.
• Watch your transactions in real time and get alerts if something seems off.
• Make payments and transfers safely from any device.
• Use modern tools to help you manage your money better.

• Banks lower their costs thanks to smart automated processes.
• Enjoy stronger security with better fraud detection and safe logins.
• Pay bills and check your account details quickly whenever needed.
• Reach more people around the world with accessible digital platforms.
• Reduce mistakes with systems that update in real time.

Digital banking works for regular folks and busy business owners alike. For everyday users, it means you can take care of your savings, bill payments, and spending without ever leaving home. It’s a safe and reliable way to keep your money matters organized. For business owners, digital banking makes handling payments easier, improves cash flow management, and cuts down on paperwork so you can focus on growing your business. Whether you’re building your personal savings or running a company, digital banking offers a smart and modern way to manage your finances in today’s fast-moving world.

Digital Banking Evolution: Historical Development and Drivers

img-1.jpg

Back in the 1980s, banks first dipped their toes into electronic services. At that time, digital transactions were a new idea, mostly giving customers the chance to check their account details and handle simple transactions. When the internet became a big part of everyday life in the 1990s, banks started offering online bill pay and ways to deposit checks remotely. This early change set the stage for the more interactive and user-friendly platforms we have now.

After 2007, mobile technology took off, and banks responded by investing in mobile apps and websites that work well on any device. They also began using cloud services to lower costs and adapt quickly to growth. This shift meant banks could offer services that run around the clock, which is something many millennials and Gen Z customers now expect.

Recent market data shows that digital banking is growing fast. For example, global net interest income is expected to reach $1.61 trillion in 2025 and climb to about $2.09 trillion by 2029, with China projected to generate around $528.8 billion in 2025. Customer demand for convenience and lower costs continues to push banks to improve their digital services. Today, they refine early digital techniques to deliver fast, safe, and effective financial services for a tech-savvy audience.

Digital Banking Technology Framework: Core Infrastructure and Platforms

Cloud-Native Core Systems

Banks now use cloud-hosted systems to manage their key operations. These systems let them quickly add resources when demand spikes, which saves money and boosts performance. They are designed to stay online almost all the time and quickly adapt as customer needs change. For example, when there’s a rush of transactions, banks can ramp up processing power, kind of like opening extra lanes on a busy highway.

Mobile and Web User Interfaces

Mobile and web apps are the face of digital banking for customers. They’re built to look good and work well on any device, making it easy to use. With these tools, you can check your balance, move money, and get timely alerts all from your smartphone. The clear and simple design makes banking as easy as reading a text message.

API and Ecosystem Integrations

Open APIs, short for Application Programming Interfaces, are at the center of today’s connected banking. They let banks link up with fintech partners, add useful services, and support creative tech ideas without overhauling everything. This flexible system makes it easy for banks to launch new features quickly and cost-effectively. In the end, a smart, connected tech system helps banks deliver secure, efficient, and forward-thinking services for everyone.

Digital Banking Services: Online, Mobile, Wallet, and Lending Offerings

img-2.jpg

Online Banking lets you open accounts, check your balances, transfer money, and pay bills using a secure website. It’s as simple as logging in to quickly review your monthly statement, much like checking your email.

Mobile banking brings these features right to your smartphone. You can deposit checks with your phone’s camera, receive alerts about payments, and even get location-based offers that help you manage your money while you’re on the move.

Digital wallets keep your payment details safe and make contactless payments easy. Thanks to near-field communication, which lets devices interact when they’re close, you can tap to pay without needing cash or physical cards. This makes everyday purchases almost instant.

Automated lending uses smart computer tools to give you fast loan decisions by cutting through all the extra paperwork. Plus, in-app robo-advisory offers personal investment tips for saving and trading based on your goals. Many users appreciate the quick, precise service these modern tools provide.

Overall, digital banking services bundle a range of helpful financial tools into one easy system. Whether you’re handling your daily finances or managing business cash flow, these digital methods replace old-fashioned banking with modern, smart solutions.

Digital Banking Security: Measures, Regulations, and Best Practices

Banks really mean it when they say security comes first. They use strong layers like multi-factor authentication (which means you prove your identity in more than one way) and end-to-end encryption (that scrambles your data so only you and your bank can read it) to protect your money and personal details with every digital move you make. They even check each transaction in real time so that if you try to sign in from a new device, you might get a quick text with a one-time code to confirm it's you.

Digital banking tools also stick to strict rules and laws to keep everything safe. When you join, there are built-in steps like Know Your Customer (KYC, a way for banks to confirm who you are) and Anti-Money Laundering (AML, rules to stop illegal money flow) that help prevent fraud. Banks follow big standards like GDPR, PCI DSS, and local guidelines to give you peace of mind that your financial info is well protected.

Banks are now even leaning on smart systems powered by artificial intelligence to outsmart fraud quickly. These systems learn from every transaction, spotting potential issues in a flash. With these AI-powered checks working alongside traditional risk management, experts believe fraud could drop by up to 50% by 2025, keeping your online transactions secure around the clock.

img-3.jpg

Artificial intelligence is changing the way we do digital banking. Banks now use chatbots that can predict what you might need and offer fast, automated help. These smart tools tailor services so that every interaction feels smoother and more natural. Imagine a chatbot that takes care of your usual transactions while also alerting you to any unusual activity, just like having a friendly digital assistant by your side.

Blockchain is also stepping into the spotlight by making payments quicker and more transparent. When banks use blockchain technology to handle payments and tokenization, transactions happen faster and with less risk. This means your money moves almost instantly, and you get the peace of mind that every step is securely verified.

Social media is becoming a strong partner in the world of finance as well. More banking apps are linking up with popular social platforms to send alerts directly to you. Think about getting a quick notification about your account updates while you scroll through your feed, mixing social fun with smart money management.

Voice-enabled banking is another exciting trend on the rise. With smart speakers and wearables, you can now handle your finances by simply talking out loud. It’s as easy as asking a question, which brings a whole new level of convenience. And with forecasts suggesting a $2.09 trillion net interest income by 2029 and billions of transactions happening worldwide, digital banking is on track to create a more interactive and connected financial future.

Final Words

In the action, this post walked you through modern digital banking's clear scope, its shift from traditional branch visits, and how key tech and security measures work together. Small breaks covered core features like streamlined transactions and mobile tools, plus the smart technology sparking market trends. By painting a clear picture, you now see how these digital tools help you manage money better. Remember, understanding what is digital banking equips you to make smarter moves for a secure financial future.

FAQ

What are examples of digital banking?

The examples of digital banking include mobile apps, online account management, digital wallets, automated lending services, and other tools that let you manage finances easily from anywhere.

What is digital banking and how does it work?

Digital banking is the process of moving traditional bank services online. It works by giving you access to your accounts via websites or mobile apps for transactions, bill payments, and account monitoring anytime.

What is digital banking with Navy Federal?

Digital banking with Navy Federal means using their secure mobile apps and website to check balances, transfer funds, and pay bills, combining modern online features with the trust of a traditional bank.

What are the advantages, features, and differences of digital banking?

Digital banking offers 24/7 access, lower fees, faster transactions, and enhanced security. Its features include mobile apps, online bill pay, and digital wallets, setting it apart from traditional in-branch banking.

Is digital banking good, and are there any disadvantages?

Digital banking is generally good because it offers convenience and cost benefits. Some users may miss face-to-face help and need reliable internet to access their accounts, making it less ideal for everyone.

What do digital banking PDFs typically cover, including its history?

Digital banking PDFs usually cover definitions, evolution, key features, and benefits. They explain the shift from branch-based services to online and mobile platforms with in-depth historical insights.

What is the difference between online banking and digital banking, and how does a digital bank account differ from a normal bank account?

Online banking is a part of digital banking focused on web-based services. Digital banking also includes mobile apps and digital wallets, while a digital bank account is fully online, eliminating the need for physical branch visits.

Savings Plan Formula Ignites Financial Growth

Have you ever noticed that a small change in your saving routine can lead to big rewards? Picture each deposit as a tiny building block stacking up over time. With regular deposits and compound interest (that means earning interest on both your original money and the interest it earns), you can gradually secure a brighter financial future. In this post, you’ll see a simple method that steadily grows your nest egg with every deposit.

savings plan formula ignites financial growth

The savings plan formula is a simple strategy that shows how your money can grow over time. When you make regular deposits and let compound interest work for you (that is, earning interest on both your original savings and the interest it accumulates), even small amounts can turn into a big sum. The magic equation, FV = P x [((1 + r)^n – 1) / r], acts like a recipe to help you plan your financial future.

Think of this formula as a trusted roadmap on your journey to financial security. It factors in both the deposits you make regularly and the power of compound interest to show you how your funds can steadily increase. Whether your interest is added monthly or daily, this plan shows how every consistent contribution builds toward a solid financial cushion. In short, every small step you take today helps create a more secure tomorrow.

  • Deposit amount (P): The regular sum you set aside.
  • Interest rate (r): How fast your money earns extra money (similar to an annual yield adjusted for compounding).
  • Number of periods (n): The total occasions you add to your savings.
  • Future value (FV): The complete sum you end up with after adding both your deposits and the interest.
  • Compounding frequency: How often interest is calculated and added to your balance.

All these pieces work together to form a clear plan for your future savings. Using this formula lets you see how each periodic deposit builds a strong financial base, helping guide you confidently toward your long-term money goals.

Key Variables in the Savings Plan Formula

img-1.jpg

One important part of a savings plan is deciding how much to deposit. Often, people set aside a part of their monthly income, like 20% following the 50/20/30 rule. For example, if you earn $2,500 in a month, saving $500 can help you build a solid financial cushion. Creating a detailed budget that matches your real-life expenses makes each deposit a step toward a secure future.

Another key factor is your interest rate, known as the Annual Percentage Yield (APY). This rate shows how fast your money earns extra money. It also matters how often your bank adds interest, whether daily or monthly. Imagine watching your balance slowly grow with each interest credit, every small difference in timing can make a noticeable impact over the years.

The time you plan to save is the final piece. This is measured in months or years and tells you how many times you'll add money to your savings. Setting up automatic transfers ensures you never miss a deposit, making the process simple and steady. With each regular deposit and interest credit, your financial future becomes clearer and more robust.

A Step-by-Step Savings Plan Formula Example

Imagine setting aside $500 every month from a $2,500 income, which follows the simple 20% savings rule. You deposit this money with a 4% annual interest rate, calculated monthly, and stick with it for 5 years, that’s 60 deposits in total. By setting up automatic transfers, you make saving effortless, turning a small, consistent habit into a growing wealth plan.

Let’s walk through the math behind it. We use the formula: FV = 500 × [((1 + 0.04/12)^60 – 1) / (0.04/12)]. Here, 0.04/12 converts the annual interest rate into a monthly rate. Raising (1 + 0.04/12) to the 60th power shows the effect of 60 monthly deposits. Then, subtracting 1 and dividing by the monthly rate tells us how each deposit earns interest over time. Finally, multiplying by 500 gives you the future value of all deposits with compound interest.

Following this plan, your final balance would be around $35,000 after 60 months. This example proves that even modest, regular contributions can really add up when interest does its work. Set your budget for these deposits and automate your savings to help you stick with your long-term goals. Consistent monthly saving builds a strong financial foundation, one step at a time.

Implementing the Savings Plan Formula in Excel

img-2.jpg

Imagine setting up a savings plan in Excel that feels almost like magic. You can use simple functions like FV to predict how much your deposits will grow with compound interest, PMT to figure out what you need to put in regularly, and IPMT to see exactly how much interest you're earning on each payment. It’s like entering a monthly deposit and watching your savings bloom month after month. Sure, it sounds technical, but it truly makes planning your finances easy and clear.

Next, create your worksheet with four neat columns: Date, Deposit, Interest, and Balance. The Date column tells you when each payment happens, the Deposit column shows the amount you put in, the Interest column calculates your earnings, and the Balance column tracks your growing savings over time. You can even set up formulas so your numbers update automatically. Using either a ready-made Excel template or designing your own can help you test different scenarios and keep a steady eye on your progress.

Finally, make your model even smarter by adding formulas that adjust as you update deposits. Play around with functions that change with different interest rates or deposit schedules. Test out what happens if you change your monthly contributions or if the rate shifts a bit. This hands-on method lets you see a real-time view of your financial journey, helping you tweak your approach as needed and giving you a boost of confidence with every update.

Savings Plan Formula Calculator and Advanced Strategies

Online savings calculators are a handy tool to play with different scenarios quickly. They show you how small, regular deposits can grow over time with compound interest (that means you earn interest on both your original money and the interest it makes). It’s a bit like trying out new recipes in your kitchen until you discover the one that feels just right.

A fun way to save is the 52-week challenge. You start by saving a little bit in the first week and then add a bit more each week. Over time, this simple habit builds up into a solid savings plan that keeps you engaged and motivated.

Pairing a high-yield savings account with automated biweekly transfers can also give your savings a nice boost. Using a goal-based savings estimator helps you set clear targets, whether you’re building an emergency fund for unexpected bills or saving up for a new car. Just imagine every automatic transfer as a small brick to your future, gradually building a sturdy wall.

Balancing your spending on needs, wants, and savings is really key for long-term financial health. These strategies mix smart technology with careful planning, giving you hands-on control over your money and guiding you toward a secure financial future.

Final Words

In the action, this article breaks down the savings plan formula by explaining how regular deposits and compound interest work together to boost growth over time. It walks you through key variables, an example calculation, and even shows how to set up a simple model in Excel.

It also touches on strategies like online calculators and automated transfers to help manage your money smartly. Keep this savings plan formula in mind as you build a secure plan for your future.

FAQ

What is a savings plan formula calculator and how can it be used in Excel or PDF formats?

A savings plan formula calculator estimates future savings by applying regular deposits and compound interest. Tools like Excel templates or PDF guides automate these calculations for easier financial planning.

What is a simple savings plan formula example and a step-by-step guide?

A simple example uses regular deposits and compound interest, applying FV = P × [((1 + r)^n – 1)/r]. A step-by-step guide breaks down each part of the formula to show how deposits grow over time.

What is the 50/30/20 rule of saving and how does the 70/20/10 rule work?

The 50/30/20 rule divides income into 50% for needs, 30% for wants, and 20% for savings. The 70/20/10 rule allocates income into 70% for essentials, 20% for discretionary spending, and 10% for savings.

How do I calculate my savings plan using the formula?

The calculation uses your deposit amount (P), interest rate (r), and number of periods (n) in the formula FV = P × [((1 + r)^n – 1)/r] to project your future savings from regular contributions and interest.

What is the 12 12 12 12 formula for savings?

The 12 12 12 12 formula recommends splitting income into four equal parts designated for different spending categories, promoting balanced budgeting and consistent saving throughout the year.

How Is Economic Growth Measured: Clear Insights

0

Ever wonder how you can tell if a country's economy is really booming? Imagine watching a bakery grow, making more bread and treats every day. In this post, we'll talk about simple numbers like GDP (which measures all the goods and services a country makes) and other useful figures that show growth in production and jobs. We'll break these signs down in clear, everyday language so you can see what drives a strong economy.

Measuring Economic Growth: Key Indicators and Approaches

Economic growth shows us how much more a country can produce over time. The most common way to measure this is by using GDP, which stands for gross domestic product. Imagine a bakery: if it makes more bread each day, it's a sign that things are improving. When a country produces more goods and services, it sends a clear signal that its economy is doing well, a key insight for both policymakers and investors.
There are several ways to check on this progress. First, there’s GDP, which tells us the total value of everything made within a country. Then there’s GNP (gross national product), which includes money earned from overseas investments but takes out earnings by foreigners within the country. We also look at productivity levels. This shows how effectively workers and machines work together without needing extra resources. And finally, employment rates help us understand how well jobs are growing, especially in sectors that drive the economy forward.

  • GDP: The total value of all finished goods and services produced in a country.
  • GNP: GDP plus net income from overseas investments, minus what foreigners earn within the country.
  • Productivity levels: A measure of how efficiently labor and equipment combine to produce output.
  • Employment rates: Key indicators of job creation that highlight the health of the economy.

Each of these measures gives us a different look at how strong the economy really is. Together, they form a full picture of both the output and the underlying strength in how the economy uses its people and machines.

Gross Domestic Product: Core Measurement for Economic Growth

img-1.jpg

GDP is the main number people look at when they want to know how a country's economy is doing. In simple words, GDP is the total value of all finished goods and services that a country produces in a set time. Think of it as a snapshot of how busy a nation’s economy is. Experts use GDP to watch if the economy is growing or slowing down. But there’s more to it than just one number. You have to dig into how it's measured to see things like inflation (which means rising prices) and price changes over time.

There are two common ways to measure GDP. Real GDP is adjusted for inflation, so it shows the true output by using prices from a past year as a base. Nominal GDP, on the other hand, shows numbers at today’s prices without adjusting for inflation. That way, comparing the two tells us if a rise in GDP is due to more products and services or just higher prices.

Another tool is the GDP deflator, which checks the overall change in prices for everything produced in the country. It compares the nominal GDP with the real GDP, giving a clear mix of inflation effects and actual production growth.

Measure Definition Example
Real GDP Output adjusted for inflation using constant prices Reviewing numbers over the years with prices from a fixed base year
Nominal GDP Output measured at current market prices Looking at this year’s production without any adjustments
GDP Deflator A measure that reflects price changes for all goods and services produced Comparing the nominal figure to the real one to gauge inflation

When you examine these figures together, you get a much clearer picture of the economy. It’s not just about whether GDP is up or down, but also why it is. Are we really producing more, or are prices just higher? This deeper look helps us understand how strong or weak an economy really is.

Beyond GDP: GNP and Income per Capita in Growth Measurement

GNP is like GDP but with a few extra steps. It adds the money our residents earn from investments abroad and takes away what foreigners earn here. This gives a clearer picture of the overall income available to our people, including the benefits of international money flows.

GDP per capita, on the other hand, simply divides the total GDP by the number of people. It’s a handy way to compare how different countries perform. But if a country has a lot of retirees, the number might not tell the whole story because not everyone is earning. In other words, GDP per capita can sometimes hide the true picture of economic strength for those actively working.

Some experts fine-tune these numbers by looking only at the working-age group instead of everyone. For example, studies in Wisconsin from 1970 to 2023 showed that growth amounted to about $1,022.20 per working-age person rather than just $646.16 per resident. Adjusting the figures this way makes it easier to see how changes in the population can affect the overall health of the economy.

Productivity Metrics: Evaluating Efficiency in Economic Growth

img-2.jpg

Productivity is a simple way to check how well an economy uses its resources. It shows how workers and equipment team up to make goods and services. When productivity goes up, it means more is being made with the same or even fewer inputs. Think of a factory line where the team finds a smoother method to make extra units, this smart use of resources sets the stage for steady, long-term growth.

Labor productivity tells us how much output each worker or each hour can produce, while capital productivity looks at how much result comes from every unit of investment like machines or tools. These numbers help experts find areas where things can run smoother and resources can be saved. When both types of productivity improve, it’s a strong sign that the economy is making better use of its people and resources. Keeping an eye on these measures gives a clear view of how well the economy is doing and guides smart choices for boosting efficiency and growth.

Challenges and Advanced Models in Growth Measurement

GDP and GNP numbers alone often don't tell the whole story about economic growth. Changes in the population, the size of the underground economy, and shifts in prices can easily skew these figures. When comparing real numbers to nominal ones, it can hide important inner changes or inflation effects, making it hard to see what's really happening. It might even seem like focusing on these big numbers leaves out the subtle details of how the economy is doing.

To tackle these problems, experts now use more advanced approaches. They use tools like input-output tables and econometric simulations to see how different parts of the economy are connected. In simple terms, these methods help show how a change in one area can create ripples throughout the whole system. They catch those tricky details that traditional measures might miss.

Looking at long-term and sustainable growth means we also have to think about things like how income is spread out, activities that don't happen in regular markets, and the impact on our environment. This wider view helps catch those small shifts that usual measures leave out, giving a truer picture of steady, solid growth.

Final Words

In the action, we broke down key indicators of growth and explained vital approaches like GDP, GNP, productivity, and employment rates. The post showed how these measures work together to give us insight into economic performance and how is economic growth measured in practice. It also highlighted how advanced models address traditional metrics' limits. Each method adds a layer of clarity, making it easier to see how economies strengthen and evolve, leaving us with a positive view of future financial progress.

FAQ

What is economic growth?

Economic growth means a rise in producing goods and services over time, typically measured by GDP. It indicates a stronger economy that can benefit businesses and create jobs.

Why is economic growth important?

Economic growth matters because it boosts a country’s capacity to produce, helps create jobs, and improves living standards, making the overall economy healthier and more resilient.

How is economic growth measured in America and most commonly?

Economic growth in America is measured primarily through GDP, especially real GDP which adjusts for inflation, along with nominal GDP that uses current prices for a full economic picture.

What are the two main measures and calculations for economic growth?

Economic growth is tracked by examining percentage changes in GDP figures and comparing nominal with real GDP, methods that show overall output shifts and adjust for inflation.

What are the four factors of economic growth?

Four factors include GDP, GNP, productivity levels, and employment rates; each of these indicators reflects aspects of production volume, income, efficiency, and job creation in the economy.

What is economic development and how is it measured?

Economic development is a broader idea that looks at improving living standards and wealth distribution. It is measured using metrics like per capita income and various quality-of-life indicators.

What economic growth example can illustrate these concepts?

A clear example is a country where rising GDP aligns with higher employment and productivity, demonstrating how increased production and job growth signal a healthy, expanding economy.

Global Financial Trends Fuel Bold Market Gains

0

Have you ever wondered if world finance could be setting up exciting market gains? New numbers show that inflation is cooling, real estate is holding steady, and shoppers are still motivated, even with high household debts. And then there’s generative AI, think of it as a modern tool similar to past groundbreaking innovations that now reshapes how we work and spend. Experts are spotting hints of changes in trade and rising global challenges that might change the game. Today, we break down these data-driven shifts and explore what they could mean for your everyday money choices.

The world's money system is like a big network that connects online payments, face-to-face transactions, and international money transfers. It brings together everyone from small start-ups to huge multinational companies. For the past 18 months, inflation has been easing, and many believe this could give the US economy a soft landing. People are still choosing to spend money on their lifestyles, with consumer spending going up by 2.5% in 2023, even though many households are dealing with high levels of debt.

Real estate has seen slow but steady gains because there aren't many houses for sale, all while interest rates remain high. At the same time, climate change is becoming a bigger worry for communities and economies everywhere. Then there is generative AI – a technology that people compare with inventions like the steam engine and electricity because of its potential to change the way we work. This technology might change productivity in ways we have only seen with past breakthroughs.

Before many companies turned to advanced systems, they had to rely on simple, manual methods that couldn’t keep up with growing global needs. This shows just how important it is to stay updated with new tools that can make a big difference in how businesses operate today.

If you look at expert forecasts and analysis, the picture becomes even clearer. Recent reports show that new economic patterns are woven into every part of our financial system and that global trade is constantly adapting to these changes. A January 2024 report even pointed out that rising geopolitical tensions, including trade disputes and political conflicts, are a major threat and add to market uncertainty.

All these data-driven insights are key for decision-makers around the world. They help leaders adjust their strategies to handle global economic shifts and market changes. In short, while these trends bring some caution, they also open up chances for smart market moves.

img-1.jpg

Global financial markets are changing because every country has its own set of rules. When these rules differ, businesses find it challenging to expand overseas. This mix-up makes it harder for credit markets to work smoothly and slows down the flow of money across borders.

At the heart of this issue is the struggle to align banking regulations. Think of it like sending a package that must pass through several post offices where each one has its own rules. Delays build up, and the whole market feels the impact. Political conflicts and trade sanctions only add to the uncertainty, making investors extra careful about where they put their money.

Imagine an investor deciding where to invest funds. They might lean toward regions with clear rules and steady returns. For example, one investor chose areas with supportive trading policies, saying, "Invest in places where the rules help money move without problems." This shows how stable regulations can attract more international investments.

Here are a few key points:

Key Point Impact
Varying rules Increase disruptions in credit and investment flows
Global teamwork Helps reduce risks and ease financial processes
Unified banking standards Makes international trade and investment smoother

This ever-changing situation shows us that better coordination and clearer guidelines are needed for a more predictable market and smoother financial integration.

Digital currencies are changing how markets work. Central banks are trying out digital money and stablecoins to make payments faster and simpler. Everyday deals are slowly moving online too. For example, many stores now use blockchain payment tools that help buyers and sellers connect across borders. Because things are moving so quickly, regulators have to work hard to update rules and keep up with technology.

Cybersecurity and protecting our data are big deals when it comes to digital money. Think about a small business using a blockchain system, processing payments becomes as simple and secure as sending a text message. This kind of technology makes digital transactions safer and easier in day-to-day life.

The rise of cryptocurrencies is changing traditional financial practices. Old ways are being replaced by digital innovation. Lots of new projects in decentralized finance are showing us fresh ways to handle transactions and investments. This progression is making global payments more reachable and secure, with faster processing times you can actually count on.

New ideas are always emerging in this space. As a result, both regulators and financial institutions are rethinking how services are offered worldwide.

img-2.jpg

Digital changes are making financial services easier to use. New fintech tools like payment links, APIs, and POS modules help businesses of all sizes run smoother. Mobile banking apps speed up transactions and make handling money as simple as scrolling through your favorite feed. AI and robo-advisors work like a smart friend who keeps an eye on the markets, helping companies make quicker, better choices. Did you know a small mobile update can boost transaction speeds almost instantly, like flipping a switch?

Asian financial hubs are also drawing in investors with exciting growth opportunities. Today, we see trends like:

  • FinTech innovations that reshape everyday banking with digital tools.
  • Payment solutions that make daily transactions simple.
  • Mobile banking apps that keep users engaged.
  • AI tools that boost efficiency and help with decision-making.
Innovation Impact
Mobile Banking Increases transaction speed and user engagement
AI Tools Enhances decision-making processes

These trends show how technology continues to reshape finance in bold and exciting ways.

Green finance tools like green bonds, sustainable funds, and impact investing are catching the eye of investors everywhere. Companies are using these tools to mix profit with a good environmental impact. Think about it: many investors didn’t even realize money could help fight climate change until green bonds came along.

Business investments in renewable energy are growing as the need to tackle climate risks increases. More investors are putting their money into projects that promise both returns and a boost in climate protection. In simple terms, ESG stands for environmental, social, and governance factors, basically, it’s a way to measure if a company is doing good socially and environmentally along with running smart business operations.

Working together with partners from different countries also makes a big difference. Imagine everyone pooling together for a group project where every bit counts. This teamwork helps push for fiscal responsibility and steady, sustainable growth.

These innovations in green finance are changing the way businesses think about investing. As more markets see the benefits of a sustainable approach, economic models are shifting to encourage greener, more responsible strategies.

img-3.jpg

The Federal Reserve is now thinking about cutting rates after 18 months of stubbornly high inflation. Imagine you're a business owner who sees lower rates as a way to ease borrowing costs, like finding a neat shortcut to success. At the same time, policymakers are updating rules to deal with real issues like cybersecurity, data protection, and digital currencies. These fresh changes help businesses adapt to new technologies while keeping safety and growth in balance.

Banking systems are also getting a makeover thanks to new tech tools. Picture switching from an old flip phone to the latest smartphone, everything becomes faster and more secure. Meanwhile, shifts in government spending and monetary tightening affect market behavior, much like a river finding new channels as it flows.

Working together across regions is key in this era of change. When different areas join forces, it creates a steadier market and lowers the risk of unexpected surprises during a crisis. One regulator even said, "We must work together to keep the market steady." All these changes are building a financial framework designed to boost gains while preparing the global economy for future challenges.

Final Words

In the action, we traced key elements shaping global financial trends, from market dynamics and digital currency shifts to fintech growth and sustainable fiscal innovations. The insights highlighted central bank moves, economic forecasts, and smart strategies that shape everyday money decisions. We connected data-driven evidence with real-world impact and shared a clear view of how fiscal policies, tech shifts, and green investments are shaping financial paths. The future looks hopeful and full of opportunities for improved security and growth.

FAQ

Frequently Asked Questions

What are current global financial trends today?

The global financial trends today indicate a blend of digital adoption, fintech growth, and green investments. They also show how shifts in consumer behavior and global concerns, like climate change, shape market strategies.

What insights do the World Economic Outlook and global economic outlook 2025 offer?

The World Economic Outlook and global economic outlook 2025 offer insights on steady growth mixed with challenges from geopolitical tensions and regulatory changes. For a detailed view, check the economic outlook.

How can I access a global financial trends PDF?

The global financial trends PDF compiles key data on digital currencies, fintech innovations, and sustainable finance into a concise, easy-to-read format, helping readers quickly grasp major market shifts.

What does the IMF World Economic Outlook 2025 highlight about financial trends?

The IMF World Economic Outlook 2025 highlights that global trends include controlled inflation, cautious growth, and the rising impact of digital currencies amid regulatory updates and global market uncertainties.

What economic forecast can be expected for the next five years?

The economic forecast for the next five years predicts gradual recovery with challenges like trade disputes and climate risks. It also forecasts a boost in digital assets and evolving fintech services. For details, see the economic outlook.

What are some current trends in financial services?

The current trends in financial services include a surge in digital payments, blockchain innovations, and automated banking. These changes make it easier for consumers to manage their money and access financial products.

What global financial trends are anticipated for 2025?

The global financial trends in 2025 point to increased digital currency adoption, a stronger focus on sustainable investments, and ongoing adjustments to new regulatory landscapes amid geopolitical uncertainties.

Debt Management Strategies Ignite Financial Success

0

Ever feel stuck by your debt? This guide offers simple steps to help set your money on a steady course. Imagine each debt as a puzzle piece that, when placed just right, reveals a clearer picture of your financial future.

Start by writing down every amount you owe. Next, create a monthly spending plan that works for you and make it a habit to pay on time. A few straightforward moves like these can trim your costs and bring you greater peace of mind.

Get ready for practical tips designed to spark real change and boost your financial success.

Core overview of debt management strategies for immediate impact

Debt management is more than just paying bills, it’s about creating a steady, clear financial path for everyday life. When you look at all your financial obligations together, you can see the whole picture and make smarter choices. Each step you take fits neatly into the next, helping you build a smoother, more secure future.

Start by taking a good look at what you owe. Then, work on a monthly budget that covers both fixed costs like rent and variable expenses like groceries. Stick to paying on time to keep your credit score healthy, and try to avoid adding new debt. If things get tough, it’s a good idea to ask a professional for help so you can adjust your plan along the way. This mix of checking your debts, planning your budget, keeping up with payments, and getting expert advice makes a strong plan.

  1. Comprehensive debt inventory
  2. Realistic budgeting
  3. Interest-cost reduction
  4. On-time payment focus
  5. Avoidance of new debt
  6. Progress tracking
  7. Expert consultation

Think of these steps like gears working together in a smooth machine. When every part is in place, you quickly gain control of your money, cut down on interest costs, and make it easier to pay everything off. Celebrating small wins keeps you motivated and reminds you that you’re on the right track to long-lasting financial success.

Assessing debt obligations within effective debt management strategies

img-1.jpg

The first step in creating a smart financial plan is to list every debt you owe. When you jot down each obligation, you get a clear view of your true money picture. It’s like organizing puzzle pieces so you can see exactly where each one fits.

Debt Type Balance Interest Rate Minimum Payment
Credit Card A $5,000 18% $150
Student Loan $12,000 5% $120
Auto Loan $8,000 6% $200

Take a closer look at debts with higher interest rates since they end up costing you more over time. It makes sense to pay these off first and then tailor your monthly spending to fit your repayment plan. When you organize your debt list, you often uncover chances to put extra money toward the most expensive debts.

Every extra dollar you put toward a high-interest debt helps reduce the total interest over time. Breaking everything down like this turns a big, confusing total into smaller, manageable goals. This clear approach steers your strategy toward quicker, more effective debt reduction, making your financial journey a little less overwhelming.

Budget planning techniques for debt management strategies

One smart way to handle your money is to try zero-based budgeting or the 50/30/20 rule. With zero-based budgeting, every single dollar you earn is given a job so that nothing is left idle. And the 50/30/20 rule breaks your income into three parts: half goes toward must-have expenses, 30% is for things you want, and the remaining 20% is saved or used to pay off debt. So if you earn $1,000, $500 covers your needs, $300 pays for fun extras, and $200 helps knock down your debt.

Take some time each month to look over your statements, especially spending on things like eating out or movies. Even shifting a small bit from these non-essential costs can free up more money to pay down debt. This way, you balance your budget, cover your bills, and lessen your debt, all at once.

It’s important to keep track of what you spend. Using a simple budget worksheet can help you see how small changes in your spending can add up over time. In the end, a few small tweaks can make a big difference, giving you more control over your money and making debt management feel much less overwhelming.

Refinancing and consolidation techniques in debt management strategies

img-2.jpg

Cutting down on interest and merging payments can really help free up cash and shorten how long you owe money. When you lower sky-high rates on debts like credit cards, you save money over time. And if you combine several payments into just one, managing your finances gets a lot simpler.

Debt Consolidation Loans

Think about using one personal loan to pay off multiple debts. When you merge smaller debts into a single loan, you often score a lower interest rate on the whole amount. This means you only worry about one monthly payment instead of many. Imagine tidying up a messy stack of bills with one clear and manageable payment plan.

Balance Transfer Credit Cards

Some credit cards have special offers with a 0% APR for a while, which lets you transfer your balances. These promotions help reduce interest right away, even though you might pay a fee for the transfer. Remember, it's important to clear off the transferred amount before the offer ends so you don’t end up with higher rates later. Picture it like renting a moving truck to help you shift your financial load around temporarily without extra costs weighing you down.

Student Loan Refinancing

If student loans are part of your financial picture, refinancing could be a smart choice. By swapping your current loans for a new one with a lower rate, you might save money, whether your loans are federal or private. Compare your options and see which one aligns best with your credit standing and financial goals.

In each case, you’ll want to look at the length of the loan, any fees, and how the option might impact your credit score. Pick the plan that fits best with your overall strategy for paying off debt.

Creditor negotiation tactics to support debt management strategies

Start by gathering all your financial paperwork so you can clearly explain your situation. Pull together recent balances, a detailed payment history, and even a letter that explains why you're having a tough time. Mention, for example, that you've generally paid on time to show your commitment. This solid set of documents helps prove to creditors that you're serious about handling your debt.

Next, give your creditors a call to discuss better payment terms. When you show them clear numbers, it's easier to ask for lower interest rates, a waiver on fees, or longer payment plans. Knowing exactly where you stand financially makes these talks much more straightforward. And if you feel overwhelmed, a trusted financial advisor can guide you through the process.

Finally, always get any changes in your agreements in writing. Follow up with regular check-ins to make sure the new terms are consistently applied.

Sustaining debt management strategies: tracking and professional support

img-3.jpg

Using monthly dashboards or simple tracking apps is a smart way to keep an eye on your balances and repayments. These tools clearly show how each payment slowly reduces your overall debt, giving you a snapshot of your progress in real-time. They act as handy guides so you know when to adjust your plan.

It's important to celebrate those small wins. For instance, when you cut down $1,000 from your total debt, take a moment to appreciate that achievement. These little milestones boost your morale and make the journey feel more manageable and rewarding.

Every now and then, review your plan with a credit counselor or financial planner. Their expertise can help fine-tune your debt reduction strategy and keep you on track, even when new challenges pop up.

Final Words

In the action, we explored a clear path to tackling debt. We reviewed how to assess obligations, create a realistic budget, and refine credit details to keep progress steady. We also touched on refinancing options, negotiating with creditors, and tracking success along the way. These steps offer practical debt management strategies that can spark real change and set a solid foundation for financial growth. Keep up the steady work, celebrate your progress, and let each step boost your confidence in building a secure financial future.

FAQ

What are some effective debt management strategies for individuals?

The effective debt management strategies for individuals involve listing all debts, creating a simple budget, paying on time, avoiding new debt, tracking progress, and asking experts for help.

How can I get out of debt when funds are tight?

The approach to get out of debt when money is low is to list debts, trim your expenses, and use any extra cash for key payments, gradually reducing high-interest balances.

How can I be debt free in 6 months?

The plan to be debt free in 6 months focuses on tight budgeting, cutting non-essential costs, concentrating on high-interest debts, and increasing income to boost repayment speed.

Are there free government debt relief programs or grants available?

Free government debt relief programs and grants offer help with counseling, managing debt, and sometimes financial aid; checking local agency eligibility is a smart first step.

What are the five golden rules for managing debt?

The five golden rules for managing debt are to assess debts thoroughly, create a realistic budget, always pay on time, avoid adding new debt, and track progress regularly.

What does the 50/20/30 rule for debt management mean?

The 50/20/30 rule means spending 50% of your income on essentials, using 20% for savings or debt reduction, and allocating 30% for discretionary spending.

What is the 777 rule with debt collectors?

The 777 rule with debt collectors means you should verify the debt details, know your rights, and keep consistent, clear communication to manage creditor interactions effectively.

How do accredited debt relief companies like National Debt Relief or CuraDebt help?

Accredited debt relief companies help by merging multiple debts into one, negotiating lower interest rates, and providing professional advice to create a manageable repayment plan.

Wealth Distribution Fuels Fair Prosperity

0

Have you ever thought about how the world's money is split up? Recent data shows that just a few people hold almost half of all the wealth, while the rest get only a small piece of the pie. In the United States, a tiny group owns nearly 70% of household wealth. This imbalance kicks off many debates about fairness and whether smart changes are needed. In this article, we explain what wealth distribution means and show how it affects both global trends and our everyday lives.

Worldwide and U.S. Wealth Distribution Patterns

Wealth distribution shows how assets, what people own minus what they owe, are shared within a community. Think of it like slicing a pie; sometimes one person gets nearly half while many others get only a little. Global figures reveal that the top 1% owns around 45% of all wealth, while the bottom 50% holds under 1%. Imagine if all the world’s wealth were coins: the richest would have nearly half the pile, and most folks would barely get one coin.

In the United States, the picture is equally striking. Total household wealth here is about $167.26 trillion, and the richest 10% control almost 70% of this sum. Looking closer, you see that roughly 73% of this money is held by Americans aged 55 and older. This means most of the wealth rests in the hands of a smaller, older group.

This snapshot helps us understand bigger trends in our economy. When you see these numbers, it’s clear that just a few control a lot while many others have very little. And that’s why smart policies and financial planning are needed to make sure prosperity is more evenly shared among people of all ages and backgrounds.

Historical Evolution of Wealth Distribution

img-1.jpg

Back in 1990, nearly 70% of U.S. wealth was held by families in their working years. Today, things look different. Predictions for 2025 show that about 65% of all wealth could belong to households aged 60 and older. Think of it like a slow-moving tide, over time, older families have built up more assets, while younger households find it tougher to catch up.

At the same time, the world’s debt has reached a staggering $111 trillion in 2025, which is almost 95% of the global economy. Imagine trying to run with a heavy backpack; that’s what excessive debt does, it weighs down younger families, making it harder to save and invest.

These shifts paint a clear picture of the changes in our economy over the last three decades. Age, debt, and market swings now play big roles in who owns what. With careful planning, these trends might set the stage for a fairer spread of wealth in the future.

Wealth Distribution Fuels Fair Prosperity

When we talk about who holds how much wealth, economists use some simple numbers to tell the story. One of these is the Gini Coefficient. It goes from 0, meaning everyone shares equally, to 1, where one person holds everything. For example, in Zambia, the Gini value is 0.701. That tells us there’s a big gap between those with lots of money and those with little.

Another useful measure is the Theil Index. This tool looks at differences inside groups and between them, giving us a closer look at where the biggest gaps are. And when we step back globally, we see that the top 1% owns about 45% of all the wealth. Imagine a cake where almost half of it goes to just one tiny slice, that really puts things in perspective.

Each of these measures shows us a different piece of the wealth puzzle. The Gini gives a quick glance at inequality, while the Theil digs deeper into the details. And by looking at the top 1% share, the numbers become relatable, almost like seeing a snapshot of a dinner plate with most of the food on one side. This clear picture points to why we might need changes in policy to spread wealth more fairly.

Metric Definition Sample Value
Gini Coefficient How evenly wealth is spread Zambia: 0.701
Theil Index A deeper look at wealth differences
Top 1% Share The percent of wealth held by the richest 45% globally

By comparing these numbers, we can truly understand the tools available to uncover the factors behind fair prosperity.

Global Wealth Distribution by Region

img-2.jpg

Wealth isn’t spread out evenly across the globe. North America holds about 35% of the world’s wealth, Europe follows with around 30%, Asia-Pacific sits at roughly 25%, and Africa has less than 3%. It’s clear that history, saving habits, and natural resources all play a part in shaping a region’s financial strength.

Take Liechtenstein, for example. Between 2020 and 2025, its GDP per person jumped by $67,713. This surprising change shows how even small regions can do exceptionally well when the right investments are made, even decades ago.

Here’s a quick look at what makes each region unique:

Region Key Factors
North America Mature markets and long-term investments
Europe A mix of innovation and stability driving balanced growth
Asia-Pacific Rapid industrial growth and rising savings building wealth
Africa Lower levels of investment leading to a smaller wealth share

Historical factors matter a lot, too. Regions with longstanding investment habits and higher savings have built up more wealth over time, while natural resource endowments also play a role. When these elements come together, particularly in North America and Europe, you see solid capital growth.

Analysts keep a close watch on these shifts. For more detailed trends and comparisons, you can always explore data at Global Financial Trends. It offers a clear picture of where wealth is now and where future opportunities may lie.

Older generations built their wealth over time. They had the advantage of low-cost homes and reliable retirement investments. Meanwhile, Millennials and Gen Z are facing over $1.7 trillion in student debt plus lower wages that make it tough to build wealth.

Younger households carry a heavy debt load that slows their net worth growth. For example, in the 1980s and 1990s, homes were much cheaper. Early buyers could quickly build equity, a benefit not available today.

For more details about wealth across different age groups, have a look at Generational Wealth at https://greatnewsx.com?p=.

  • Heavy student debt is holding back financial progress for Millennials and Gen Z.
  • Affordable housing in the past gave older generations a lasting asset advantage.

These points show that younger households now face different and tougher financial challenges compared to those who came before.

Wealth Distribution Fuels Fair Prosperity

img-3.jpg

History has given some groups a real head start. Colonial times and the industrial era set up advantages that still shape wealth today – like a few runners getting an early boost in a race.

Later, changes such as rising home prices compared to incomes and strong returns on retirement accounts added even more benefits. Older savers enjoyed steady market growth and years of compound interest. In other words, those early gains created a strong base for future financial success, leading to lasting wealth differences between generations.

Today, young people face challenges like student loan debt, low wage growth, and fewer opportunities to buy a home. These issues show that the benefits from the past still affect many of our financial struggles:

• Early advantages gave some people a strong start.
• Old methods of building wealth made those early benefits even larger.
• Modern hurdles slow down wealth growth for newer generations.

Policy Responses and Financial Inclusion in Wealth Distribution

Policymakers are shaking things up by looking at tax reforms and inclusion projects that might change how wealth is shared. They’re considering ideas like higher taxes on huge fortunes to help bring down the concentration of wealth at the top. Imagine extra taxes on the very rich funding better schools and healthcare, it’s a simple idea that could really change lives.

Social safety nets are a big part of the plan. Expanding things like education, healthcare, and housing support gives a fair boost to those who've struggled to get ahead. Think of it like handing out a starter pack in a game so no one has to start at a disadvantage. Groups such as Oxfam are calling for fairer rules to curb the power of big corporations and make sure resources are spread more evenly.

Another focus is making banking and credit more accessible to everyone. Financial inclusion programs are introducing tools like mobile banking apps to help people manage and grow their savings easily, imagine living in a rural area where you can handle your money with just your smartphone. Initiatives in this area work to tear down old financial barriers and welcome more folks into the economic system.

Governments are also testing out fresh ideas like universal basic income and tighter rules on corporate behavior. These trials come from studies showing that wealth isn’t evenly spread out. By exploring UBI and updating business practices, they hope to create a fairer financial arena.

All of these steps aim to tackle deep-rooted inequality. The goal is to level the playing field so that everyone has a fair shot at financial security and opportunity, no matter where or when they were born.

Final Words

In the action, we explored how wealth distribution shapes both global markets and U.S. households. We broke down key statistics, from income gaps to generational shifts, and examined how historical trends and policy measures drive these changes. This clear overview helps paint a picture of our current economic spread while pointing to ways to secure a stable financial future. With each insight, you move a step closer to making decisions that build financial security and foster real growth.

FAQ

What does wealth distribution 2022 represent?

Wealth distribution 2022 captures how assets were shared among populations during that year. It offers a snapshot of economic disparities by showing asset allocation across different groups and regions.

What does a wealth distribution chart in America show?

A wealth distribution chart in America visually presents how assets are spread among U.S. households. It uses graphs to compare wealth across income levels, age groups, and regions.

What does wealth distribution 2025 refer to?

Wealth distribution 2025 refers to projections or updated data on asset allocation by that year. It highlights expected shifts among age groups and income tiers as economic conditions evolve.

What do global wealth distribution maps and graphs reveal?

Global wealth distribution maps and graphs reveal how assets are allocated worldwide. They pinpoint regional differences and clearly illustrate economic gaps across countries and continents.

What insights does U.S. wealth distribution 2025 provide?

U.S. wealth distribution 2025 provides projections on asset shares among American households. It indicates expected shifts, especially for different age groups, as wealth concentrates over time.

What does wealth distribution by age explain?

Wealth distribution by age explains how assets vary among different age groups. It typically shows that older generations hold more wealth due to longer accumulation periods and established retirement savings.

What is the wealth distribution in the US?

The wealth distribution in the US describes how total household assets are divided among Americans. It highlights that a small, wealthiest segment typically holds a large share, leaving less for other groups.

What is the meaning of wealth distribution?

The meaning of wealth distribution is the spread of assets minus debts across a population. It serves as an indicator of economic inequality by showing who holds what portion of total wealth.

What does top 5% wealth net worth in the US indicate?

Top 5% wealth net worth in the US indicates the minimum asset level required to be in the richest group. It helps measure how concentrated wealth is among a small segment of households.

What percentage of Americans have a $1,000,000 net worth?

The percentage of Americans with a $1,000,000 net worth represents a small segment of households reaching millionaire status. This statistic underscores the concentrated nature of wealth in the country.

What Is Open Banking: Empowering Your Future

0

Ever thought your money could work smarter for you? Open banking is changing the game. It lets trusted apps access your bank info securely, but only if you say it’s okay. Think of it like a safe digital handshake that brings useful, easy-to-use tools straight to your phone.

In this article, we break down how these secure links between your bank and tech services give you more control and flexibility over your money. It’s paving the way for a future where managing your finances becomes simpler and more personal.

what is open banking: Empowering Your Future

Open banking gives trusted apps and services access to your financial data, but only if you say so. Think of it like a digital handshake that lets an app, such as a budgeting tool, securely pull in your transaction history without the need to visit a branch. It’s a modern twist on traditional banking that relies on secure connections called APIs (ways for different apps to talk safely to each other).

Instead of having to go into a bank or use only your bank’s app, open banking helps new, smart digital services show up and offer you tools that match your lifestyle. It creates a safe bridge between banks and tech companies, using strict safety methods like encryption and OAuth 2.0 (which is a secure way to verify your identity online). Many see this as a great way to put you in control of your money by giving you more choices.

By steering away from one-size-fits-all solutions, open banking keeps things simple. It’s built on clear, honest rules and gives you the freedom to pick services that really work for you. In short, it makes handling money easier, clearer, and more personalized, empowering your future one secure digital step at a time.

Core Components of Open Banking: APIs and Data Sharing

img-1.jpg

Open banking works through a variety of APIs that let banks and financial institutions share your data safely with trusted third-party providers. Think of these APIs as digital bridges that move your information securely, making everyday financial tasks simpler and more personal.

One main type is product APIs. They deliver details about financial products like interest rates, savings offers, and nearby ATM locations. Imagine browsing an online catalog of offers from your bank, product APIs make that possible by keeping the information current and easy to understand.

Another important kind is payment initiation APIs. These let money move directly between accounts. Whether you're paying your bills, transferring funds, or setting up recurring payments, payment initiation APIs work like your personal digital cashier, ensuring your money reaches its destination quickly and securely.

Service initiation APIs are the final piece. They help start services such as opening a new account or changing your credit limits. This means you can access new financial services without filling out lots of paperwork or waiting in long lines.

All these APIs use standard security measures like OAuth 2.0 and TLS encryption to protect your data. They also rely on strong customer authentication and tokenization to keep sensitive information safe. With these secure systems in place, open banking not only makes managing your money more convenient but also builds trust for a smoother financial journey.

Open Banking Advantages: Consumers, Banks, and Fintechs

img-2.jpg

Open banking makes managing money easier for everyone. It gives consumers tools like apps that show all their bank accounts in one clear view. This way, you can make smarter spending choices and plan for the future with confidence. You even get to compare products as you go, so you always know you’re getting a good deal.

Banks win too. By using open banking, banks can share data securely with trusted fintech partners. This opens the door for new digital services that really improve your experience. Imagine a bank that changes its services based on how you spend and save; it helps you and makes the bank work even better.

Fintech companies are in a great spot to create cool, new tools. They can offer services like faster payments or quick credit checks by using shared data. This not only streamlines day-to-day money tasks but also gives small and midsize businesses a boost. For example, a business owner might secure a short-term loan quickly through a handy cash flow app.

E-commerce platforms also get a boost from open banking. They can give shoppers secure and smooth checkout experiences that build trust. Meanwhile, credit institutions enjoy more accurate data to make smarter decisions when lending money.

  • Consumers gain better control over their money.
  • Banks can explore new ways to serve you and earn money.
  • Fintech companies build innovative tools that fit your needs.
  • Small and midsize businesses find easier financing solutions.
  • E-commerce sites offer safer, smoother payment options.
  • Credit institutions assess risk more precisely.

With open banking, everyone in the financial world becomes more flexible and responsive, creating a win for both customers and companies alike.

Ensuring Security and Privacy in Open Banking

Open banking uses modern tools and clear rules to keep your money details safe. It leans on smart technology like OAuth 2.0, a bit like a special lock on your phone that only lets trusted apps in, and TLS encryption, which protects each digital connection so no one can peek in.

Strong Customer Authentication, or SCA, adds another safety layer. With SCA, you might get a code on your phone or use your fingerprint before making any important changes. This extra check makes sure only you are in charge of your account.

Tokenization is another smart trick. Instead of sending your real bank details over the internet, it swaps them for random codes. Imagine using a secret code instead of your actual bank account number so that your personal details stay hidden.

Banks also use AI-powered systems that watch every transaction in real time. These systems flag any unusual activity immediately, stopping fraud before it gains ground. Plus, there are strict rules that keep detailed logs of who can access your data, so you always know what's happening with your money.

By combining these strong tech measures with clear guidelines, open banking creates a safe space for your financial life. This mix of technology and rules not only protects your money and personal details but also builds trustworthy, open financial services that you can feel good about.

Open Banking in Action: Use Cases and Examples

img-3.jpg

Open banking really shines when companies put APIs to work in everyday life. Take Capital One DevExchange, for example. It lets trusted third parties confirm identities, start secure transfers, and check transaction details using tokens. It’s a bit like using a digital key to open a smart lock. In fact, Capital One’s system uses API tokens just like a digital key.

Citi Developer Hub is another great case. It offers tools that bring together account data from different sources, handle transaction information, and even pull reward details based on where you are. Think of it like a neat file cabinet where each drawer holds a unique piece of your financial story. Believe it or not, in some areas, Citi’s API lets customers view rewards, transactions, and account details all in one place, almost like browsing a personalized digital magazine.

Brazil’s Open Finance Ecosystem is a big success story. Created over five years with input from more than 700 people, it now reaches 60 million users. This system unites various financial services, from banking to investing, on one easy-to-use platform. You might be surprised to learn that Brazil built a complete financial ecosystem that touches 60 million lives, showing that open banking is more than just a buzzword.

SEB’s API Transformation is another practical example. They revamped their API platform to handle about 200 APIs across many different financial products. This upgrade boosted their speed and opened up new revenue doors. Imagine a busy marketplace where every stall is linked by one network, making data swap quick and service even better.

  • Capital One DevExchange: Helps verify identities and secure transfers.
  • Citi Developer Hub: Gathers account data and adapts to local needs.
  • Brazil’s Open Finance Ecosystem: Connects millions of users through collaborative finance.
  • SEB’s API Transformation: Enhances service delivery and opens new business opportunities.

Beyond Open Banking: The Future of Open Finance

Open banking is growing fast. It is not just about bank accounts anymore. Soon, you could handle your insurance, investments, and loans all from one place. Imagine checking your money, buying insurance, and planning your investments on a single, easy-to-use platform. This change is opening up digital finance opportunities that fit into everyday life.

New tech is behind this shift. AI, for example, can give advice that feels like chatting with a friend who really gets you. And blockchain works like a clear digital record keeper that everyone can trust. Even systems that work without traditional banks, called DeFi protocols (which let you manage your assets without a regular bank), are joining in to make handling your money simpler and safer.

Fintech companies are teaming up to offer integrated platforms. Think of it as a group effort where different players share the best tools to give you live updates on your money. You may soon enjoy features like automatic budgeting and 24/7 account monitoring. These platforms might even take care of your wealth for you, so you can concentrate on other parts of your life.

If you want to see more examples of how these ideas are changing the game, check out Future Financial Trends in Banking. In this new world of finance, everything is more connected, clear, and easy to manage.

Final Words

In the action, we explored a clear definition of open banking and how APIs and data sharing work together to give you control over your financial information. We broke down key regulations, the benefits for banks, consumers, and fintechs, and the strong security measures that back this system.

We also saw open banking in action with real-world examples and discussed its evolution into open finance. Embracing what is open banking can pave the way for better financial security and growth. Stay curious and keep moving forward with your financial planning.

FAQ

What is open banking examples?

Open banking examples include platforms like Capital One DevExchange and Brazil’s Open Finance Ecosystem, which let third parties securely access bank data using APIs to provide tailored financial services.

What is open banking Mastercard and is PayPal open banking?

Open banking services from companies like Mastercard and PayPal use APIs to enhance payment processing and customer experience, though each product may vary in how much they embrace the full open banking model.

What is open banking and how does it work?

Open banking works by letting trusted third parties access bank data via secure APIs, with customer consent, to offer personalized financial services beyond traditional banking interactions.

What is open banking Reddit?

On Reddit, open banking is a hot topic where users share experiences, discuss security protocols, and explore how secure data sharing can improve everyday financial management.

Is open banking safe?

Open banking is built with safety in mind; it uses strong authentication, encryption, tokenization, and strict customer consent to protect financial data and maintain user trust.

What is open banking payments?

Open banking payments use secure APIs to directly move funds from bank accounts for transactions, making payment processes faster and reducing reliance on traditional payment intermediaries.

What are open banking companies?

Open banking companies include both banks and fintech firms that leverage secure APIs to offer innovative services, enhance the customer experience, and create additional revenue streams.

What is open banking API?

Open banking APIs are secure tools that let approved third parties access banking data, supporting tasks like product details, direct payments, and account management through encrypted protocols.

What is open banking in simple terms?

Open banking in simple terms means banks share customer data securely, with consent, so approved providers can offer more personalized, efficient, and user-friendly financial services.

What are the pros and cons of open banking?

Open banking offers benefits like personalized financial services and new revenue options but may come with risks like potential data breaches and privacy issues if not managed carefully.

What is open banking when renting?

When renting, open banking can help landlords securely verify a tenant’s financial health using approved data access, leading to faster application processes and fewer reliance on traditional checks.

Brokerage Reviews: Stellar Ratings For Smart Trading

0

Have you ever wondered if your broker is really the right match for you? Brokerage reviews break down costs, available tools, and support so you understand what you’re paying for.

We rate brokers with simple scores, focusing on fees, ease of use, and customer service. In our post, we compare brokers so you can see how they measure up on what counts. Clear ratings guide you toward smarter trading choices and help keep your money safe.

Brokerage Reviews: Stellar Ratings for Smart Trading

Our review method helps investors cut through the clutter and find brokers that truly fit everyday needs. We use honest, simple measures that are scored and weighted to give you a complete picture. This way, our reviews focus on the things that matter most: costs, tools, ease of use, and support. For instance, you can check out the detailed metrics on Interactive Broker Reviews to see how these add up.

We look at five key areas: commissions, fees, platform usability, research tools, and customer service. Commissions and fees cover the cost of each trade and keeping your account active. Platform usability shows how easy it is to trade and track your investments. Research tools measure the quality and amount of market information you get. And customer service tells you how quickly and well brokers answer your questions. Each part is important in shaping trader choices and building trust.

Risk management is a big part of our reviews too. Did you know that 73.42% of retail CFD accounts lose money? This highlights the risks in these markets and shows why picking the right broker is key. By scoring brokers on these major factors, our method helps investors avoid options that aren’t a good fit. In short, this process is designed to help you make smart choices and keep your money safe as you navigate the market.

Comparing Brokerage Fee Structures in Reviews

img-1.jpg

When it comes to investing, knowing the fees is like having a map before you set off. Whether you're new or have been trading for years, understanding every fee can help you plan better and dodge any surprises. Reviews of different brokerages lay out each fee clearly so you can see exactly how the costs add up and make decisions that fit your money plan.

  • Per-trade commissions
  • Account minimums
  • Margin interest rates (this is the cost of borrowing money to buy more stocks)
  • Inactivity fees
  • Transfer or withdrawal charges

Every investor cares about different fees. Some people try to keep costs low by choosing brokers with small per-trade commissions and no secret charges, which can save money over many trades. Others look for brokers with low account minimums, so they can start investing even if cash is tight. If you trade on margin, watching the margin interest rates closely is important because even small differences can grow over time. For those who trade less often, avoiding inactivity fees is a smart move to keep your money safe. And if you ever decide to switch brokers, knowing about any transfer or withdrawal charges can help you avoid unexpected costs. Clear, side-by-side fee breakdowns give you the power to pick the broker that matches your trading style and budget, setting you up for success.

Trading Platform Assessments in Brokerage Reviews

Modern trading platforms focus on making your experience smooth and fast. A clean, easy-to-use interface helps you trade without hassle. Seconds matter when prices change, so tools that let you place orders quickly, show live updates, and allow fast adjustments are essential. Both agents and investors gain from platforms that mix smart technology with clear, friendly designs.

  • Intuitive user interface
  • Powerful charting tools
  • A variety of order types (see how to trade options)
  • Fast execution speed
  • Stable mobile app performance
  • Customization choices

Top platforms blend good looks with great performance. For instance, the Real Agent mobile app sends instant trade alerts and works on a cloud system. This lets you check market trends on the go while keeping your system responsive. Some platforms even add features to track your earnings easily and include a handy "Match me" filter to help select the best software for you. Many also offer day trading software that stays reliable even during busy market moves, a real plus in today’s fast-paced world.

Broker Support and Mentorship Ratings

img-2.jpg

When you’re trading, quick help matters. Top brokers offer live support through phone, chat, and email, so a call or message gets you answers fast, often within minutes during busy market hours. This speedy response helps you make decisions quickly and builds trust.

The best brokerages also have solid training programs that really stand out. They run daily online classes, pair you with a mentor, and offer specialized training tools. Many traders say that regular webinars and one-on-one mentor sessions break down trading strategies in clear, simple ways. This kind of guidance makes it easier for both beginners and seasoned traders to polish their skills and tackle the market with confidence.

Security and Compliance Standards in Broker Reviews

Top brokerages shine by using robust safety measures to protect your money. They protect your data with strong encryption that scrambles it so only you can see it, include SIPC insurance (a safety net that steps in if a firm fails), and require two-factor authentication, which means you confirm your identity with an extra step when logging in. These layers work together to keep your funds secure and help you feel more confident about trading.

Regulations matter, too. Brokers now follow strict rules and update their systems as financial guidelines change. They even undergo regular checks by independent auditors to ensure these safety measures work as they should. This process gives you a clear look at how a broker handles risks and secures your digital data.

Final Words

In the action, we explored a well-organized review strategy covering key factors like commissions, fees, platform performance, and support. We also touched on real fee structures, platform features, and the value of live support alongside mentorship programs. Security standards and regulatory compliance were clearly highlighted too.

All these insights help form solid brokerage reviews that simplify complex financial evaluations. It leaves you with clear steps to boost your financial security and growth. The future looks bright when you have information on your side!

FAQ

Q: What are the best brokerage reviews?

A: The best brokerage reviews follow a structured method that assesses commission fees, platform usability, research tools, and customer service. This approach helps both beginners and experienced investors make informed decisions.

Q: Which brokerage is best for beginners?

A: Brokerages best for beginners feature simple interfaces, transparent fees, and reliable customer support. These factors help new investors build confidence and ease into managing their investments.

Q: What brokerage do most millionaires use?

A: Many millionaires choose brokers that offer robust support, advanced trading options, and dependable market research. These firms combine strong security with high-quality service and detailed investment insights.

Q: How do I know if a broker is good?

A: A good broker can be identified by checking key factors like low commission fees, fast execution times, responsive customer service, strong security measures, and positive user reviews from reliable sources.

Q: What are some top online brokerage accounts?

A: Top online brokerage accounts provide competitive pricing, user-friendly platforms, and solid security features like SIPC coverage and two-factor authentication, making them suitable for various trading or investment needs.

Q: What is a top broker CRM?

A: A top broker CRM refers to a customer relationship tool used by brokerage firms to maintain efficient client communication and personalized service, which enhances user experience and overall trading support.

Q: What are key features of trading platforms in brokerage reviews?

A: Trading platforms are praised for their intuitive design, advanced charting tools, diverse order types, and fast execution speeds. These features help traders act quickly and make informed investment decisions.

Q: How are the best brokerage accounts for long-term investing evaluated?

A: These accounts are evaluated on low fees, strong research capabilities, efficient customer support, and reliable security measures. These elements work together to support long-term wealth growth with minimal risks.

Q: What is the Webull brokerage account known for?

A: The Webull brokerage account is known for its commission-free trading, easy-to-use mobile app, and robust analytical tools. These features make it a popular choice for active traders seeking efficiency.

Q: How does Vanguard online brokerage stand out?

A: Vanguard online brokerage stands out by offering low-cost investment options, reliable research tools, and strong security practices. Its focus on long-term growth and client protection makes it a trusted option for many investors.

Q: What constitutes a full-service brokerage firm?

A: A full-service brokerage firm offers personalized financial advice, detailed market research, a variety of investment products, and dedicated support. This comprehensive service is ideal for investors seeking guidance alongside trading capabilities.

Actionable Data Fuels Smart Business Moves

0

Have you ever wondered if a jumble of numbers can change your business plan? It turns out, messy data can be cleaned up and turned into simple signals that help you make smart choices. Think of it like following a map: scattered figures guide you to find a quicker route. Imagine seeing a graph that shows a 10% boost in sales when deliveries speed up. This shows how turning raw facts into clear, everyday steps can really power up your business.

How Actionable Data Powers Strategic Business Decisions

Actionable data means taking raw numbers and turning them into clear insights that help us make smart decisions every day. Every day, businesses generate over 495.89 million terabytes of information. At first glance, it might look messy and hard to understand, but once it’s sorted and analyzed, it becomes very useful.

Imagine opening a simple dashboard and seeing a trend graph that shows, "Sales increased by 10% when delivery times shortened." That clear picture lets managers know what’s working and what needs attention. It’s like having a trusted friend point out the good and the not-so-good parts of your strategy.

Leaders now rely on these solid numbers instead of just guessing. Detailed key performance indicators (KPIs, which are measurements that help track how well a business is doing) act like guideposts for different teams. For instance, a manager might notice that smoother operations lead directly to better customer feedback.

By routinely measuring and comparing these numbers, companies can quickly spot opportunities and make changes. This approach transforms confusing facts into clear, strategic steps, helping businesses stay agile and improve everything from sales to daily operations.

Core Methods for Converting Raw Figures into Actionable Data

img-1.jpg

When companies face a pile of messy data, it can feel like you're lost in a maze. Turning all those raw numbers into clear, steady signals helps teams know exactly what to do.

The journey begins with cleaning up the data and making sure everything is accurate. With a few simple steps, those rough figures become easy-to-read signs that guide smart actions. Here are six common methods used:

  • Data cleansing and normalization
  • Classification and tagging of records
  • Statistical modeling for finding correlations
  • Interactive dashboard visualization with charts, graphs, and heatmaps
  • Continuous real-time processing to catch issues as they happen
  • Machine learning-based forecasting for predicting demand or risk

For example, imagine a manager checking an interactive dashboard and spotting a drop in customer satisfaction right after a new product launch. Instead of relying on gut feelings, the team can quickly adjust and fix any issues.

Many tools now combine ERP, CRM, and outside data all in one user-friendly platform. This integration gives leaders a crystal-clear view of what matters. With real-time analytics and trend forecasts, businesses shift from guessing to knowing, making every decision confidently backed by structured insight.

Tools and Platforms for Actionable Data Extraction

Platforms like Phocas BI bring together data from ERP, CRM, and other sources into one easy-to-use screen. They help teams turn a jumble of numbers into clear, simple insights. Tools such as Power BI, Tableau, and QlikView let you drag items around, filter details, and get real-time alerts. Think of it like a sales team spotting a change in buying habits on a dashboard, much like a pilot checking essential instruments during a flight.

Open-source tools like Python’s Pandas and D3.js let you build custom data pipelines that change raw numbers into interactive visuals. When a manager sets up these displays, they quickly spot patterns that drive smart decisions. Some advanced features even use artificial intelligence, which means computers learn and predict, to flag unusual activity or forecast future sales. This way, teams can catch problems early and act before small issues grow.

Many of these platforms follow a step-by-step, evidence-based process that turns messy data into neat reports. For example, a live dashboard might include a tool like Market Sentiment Trends Analysis to watch how customer moods change. Each tool plays a key role in turning numbers into a clear story for better decision-making and faster action.

Implementing Actionable Data in Operational Strategies

img-2.jpg

Turning customer feedback into clear numbers using language processing tools helps our teams make everyday information work for them. Manufacturing, wholesale, and distribution groups use pricing tools to adjust rates as market conditions change. Supply-chain managers tap into cost-saving tricks to cut overhead and keep operations running smoothly. And leaders who focus on customer experience can look at sentiment scores from organized feedback to fine-tune service steps. Dashboards then bring together key performance numbers that tie directly to company goals, making decision-making feel simple and clear.

By transforming messy, unstructured feedback into easy-to-understand metrics, companies set up a cycle of constant improvement. Using real-time data, teams can fine-tune pricing, tweak operations, and upgrade services based on what they see happening right away. This approach helps managers spot chances to save money and improve how they connect with customers. As new data flows in, predictive tools update the figures so every department can access the practical insights they need to make smart decisions. This means choices aren’t based on guesswork, they follow clear, measurable trends. In the end, turning raw feedback into reliable data forms the backbone of well-planned strategies that let businesses react quickly to market changes and customer needs.

Measuring Impact: Case Studies of Actionable Data in Action

Companies use data to help shape their strategies and improve their services. They turn everyday information into clear insights that guide smart choices.

Take gaming forums, for example. Developers listen to players’ honest feedback by sorting comments into key topics. This helps them fix glitches and improve game features. One manager mentioned, "We listened closely to players, and fixing a few glitches made a big difference."

Marketing teams also gain a lot from clear data. When they look at campaign feedback, they quickly see which ads work best. Imagine a team that notices one ad gets a lot of positive responses, they might shift more funds to ads that look promising.

Customer support teams learn from online comments too. By paying attention to remarks about wait times or refund issues, they can streamline their service. One representative recalled, "We changed our refund process based on common feedback, and it really improved our service."

Tracking the overall mood around a brand is another powerful tool. By measuring how many positive and negative mentions there are, companies can see how the public feels in real time. This helps them tweak their messaging quickly.

Lastly, managers rely on big data to guide tough decisions. They gather information from various sources, turn unstructured feedback into clear reports, and use these insights to adjust pricing and operations. A simple three-step approach, tracking, transforming data, and constantly measuring feedback, helps build a strong foundation for informed decisions.

Final Words

In the action, we saw how actionable data turns raw figures into clear insights that guide business moves. The blog covered key methods like data cleansing, statistical modeling, real-time dashboards, and more. It also highlighted top tools that help teams visualize and act on numbers, boosting everything from customer service to supply chain efficiency. Case studies showed how this approach makes a real difference. With actionable data driving smarter strategies, businesses can move forward with confidence and secure a bright financial future.

FAQ

What is the meaning of actionable data?

The actionable data meaning is raw information that’s been processed into clear insights, helping decision-makers take real steps and drive better business outcomes.

How can actionable data be used in a practical example?

Actionable data shows up when customer feedback and key numbers are analyzed to adjust products or services. This clear information sets up specific business actions.

What are some synonyms for actionable data and insights?

Actionable data can also be called practical data or useful insights that directly inform business decisions and spark measurable actions.

What does actionable insights in data analytics refer to?

Actionable insights in data analytics mean information that’s been analyzed to reveal clear steps, like adjusting pricing or improving customer service based on real-time trends.

What are three common types of data?

Three common types of data are structured data, which is organized; unstructured data, which is raw; and semi-structured data, which blends both organized and free-form elements.

Free Portfolio Analysis Tools Spark Smart Investing

0

Ever stop to wonder if your investments are truly working as hard as you are? Free portfolio analysis tools give you the real-time facts you need to make smarter choices.
Imagine checking out live market data, clear charts, and simple performance numbers, all without spending a dime. These tools cover everything from stocks to cryptocurrencies, helping you see how every move shapes your overall plan.
Today, we’re walking through these useful resources and showing you how they can boost your confidence when managing your assets.

free portfolio analysis tools Spark Smart Investing

Today’s free portfolio analysis tools make it easy to keep an eye on many types of investments, such as stocks, ETFs, cryptocurrencies, and even real estate. These tools give you live market data, simple charts, and customizable lists so you can see exactly how your assets are performing. For example, Yahoo Finance updates market information every 15 seconds and lets you create unlimited watchlists and portfolios to keep track of changes. Meanwhile, Portfolio Visualizer offers smart insights like volatility tracking, drawdown checks, and risk-adjusted returns, even though you have to import your own data. And then there’s SigFig, which adds a personal touch by giving you free investment reviews and tailored asset allocation ideas.

Many of these tools go beyond just tracking your investments. Empower, formerly known as Personal Capital, combines budgeting with investment tracking and even shows you your portfolio breakdown in an easy-to-read mosaic chart. This all-in-one approach helps you quickly understand your financial situation while monitoring risks and how your assets are spread out. Some platforms even offer both free and paid features, as noted in reviews like those for Morningstar Portfolio Manager. No matter which tool you choose, these free platforms meet the basic needs of investors by providing clear performance metrics, risk insights, and asset comparisons that let you manage your portfolio smartly.

Top Free-of-Charge Portfolio Analysis Tools Compared

img-1.jpg

Tool Key Features Asset Support Limitations
Yahoo Finance Real-time price updates, easy-to-read technical charts, and unlimited watchlists Stocks, ETFs, cryptocurrencies, and more Doesn’t offer many advanced analytics
Portfolio Visualizer Backtesting, Monte Carlo simulations, and clear risk metrics (Risk Management Techniques) A wide range of asset types with useful risk data You need to enter data by hand and can’t export reports
Empower Portfolio tracking that links to your budget along with a mosaic-style visualization Offers a broad coverage of assets May send promotional messages if your balance is high
SigFig Automated suggestions for asset allocation and tax-loss harvesting Includes stocks, bonds, and mixed holdings The free tool is only for checkups; advanced advisory comes at a cost
Stock Rover Customizable screening tools, deep research metrics, and a free trial Focuses on stocks and ETFs The free trial lets you use only a limited number of watchlists
Sharesight Tracks dividends and automates tax reporting Great for international equities and dividend portfolios The free plan supports up to just 10 holdings

Picking the right free portfolio analysis tool comes down to finding one that fits your personal style. If you love getting real-time numbers and clear charts, Yahoo Finance might be the perfect match. For those of you who want a deeper look at risk with cool simulations, Portfolio Visualizer could be a great choice. And if budget tracking matters to you, Empower ties that directly into your investments. SigFig offers quick, automated tips to help guide you, while Stock Rover gives extra details for research fans. Finally, Sharesight works well if you focus on international stocks or dividends. Each tool is built to meet different needs, whether you’re managing everyday portfolios or diving into more detailed financial analysis.

Feature Breakdown of Zero-Cost Portfolio Analysis Tools

Zero-cost tools aren’t just about listing features, they give you a chance to see how your investments might perform when markets change. These tools help you test different market scenarios, understand risks through real-life examples, and adjust your strategy with real-time insights.

For example, you can use Monte Carlo simulations and backtesting to see how your portfolio might cope with a tough economic period, like a recession. It’s like putting your safety gear to the test when things get rough.

They also show you risk-adjusted returns and drawdown analysis, which means you get a clear look at how your investments handle dip moments. Think of it as checking if your portfolio is wearing the right protective gear during unexpected market dips.

A cool feature is the mosaic plot, which breaks down your domestic versus international holdings in a visual way. Imagine quickly noticing that 60% of your funds are working locally while 40% are invested overseas.

There’s even automated portfolio rebalancing and tax-loss harvesting running quietly in the background. These features help manage your mix of investments, so you avoid making rushed decisions when markets shift suddenly.

Plus, you get real-time data updates with unlimited watchlists. This means you can keep an eye on several stocks at once and spot a price change right as it happens.

In a nutshell, these detailed insights let you match specific features with your investment goals. They help you see what might happen and plan accordingly, all while keeping the process simple and clear.

How to Select the Right No-Charge Portfolio Analysis Platform

img-2.jpg

Choosing a free tool that helps you track your investments is a smart way to stay on top of your money. You want a platform that matches your own level of experience. Some investors enjoy a tool loaded with extra features, like Portfolio Visualizer, while others appreciate a simpler setup like Yahoo Finance.

When you compare your options, keep a few simple points in mind:

  • Complexity: Do you need detailed tests of your strategies or just basic price tracking?
  • Data Integration: Does the tool update your data automatically, or will you need to enter information by hand?
  • Asset Support: Does it cover the kinds of investments you own?
  • Update Frequency: Would real-time updates help you, or are regular updates enough?
  • Access and Usability: Is the interface user-friendly, and can you check your portfolio easily on a mobile app?

In the end, pick a platform that fits your personal goals, your level of expertise, and the types of assets you manage.

Leveraging Gratis Portfolio Analysis Tools for Effective Portfolio Management

Regular checks with free portfolio analysis tools help you spot changes in how your investments are spread out and the risks involved. When you review your portfolio every few months, you get a quick look at your investments' overall health. This way, you make sure every change you make fits with your long-term money goals.

Mixing portfolio reviews with budgeting and cash flow plans adds an extra layer of control over your finances. For example, linking your investment tool with your budget gives you a full picture of where your money is going. Tools like Portfolio Visualizer and Yahoo Finance let you download detailed reports and set alerts, so you always know what’s happening in real time and can adjust your plans when needed.

Staying disciplined is key to managing your portfolio well. Free analysis tools act like a digital check-in for your investments; they remind you to take a look regularly, update your mix when changes occur, and stick to your financial goals. This helps keep your investment approach both smart and organized.

Free vs Premium Portfolio Analysis Tools: Costless vs Paid Solutions

img-3.jpg

Free portfolio analysis tools can be a bit basic compared to what premium plans offer. For instance, with Portfolio Visualizer’s free version, you have to import data yourself and you can’t save or export scenarios. On the other hand, their $19/month plan automates these tasks, making everything a lot simpler.

Morningstar’s free manual-entry analysis is useful, but it doesn’t sync multiple accounts or give detailed fee breakdowns like the $20.75/month annual premium plan does. Similarly, Empower’s free service fits many investors, but if you have a larger balance and need extra advisory support, you might need to pay more. Then there’s Kubera, which offers broader asset integration for $199 a year, meaning free options might not work well if you have a complex mix of assets.

As your portfolio grows in size and variety, a premium subscription might really be worth it. When you’re juggling stocks, bonds, cryptocurrencies, and real estate, paying a bit extra can get you tools like automatic data imports, thorough risk reports, and the ability to save backtesting scenarios. This upgrade can give you clearer insights and a smoother process to help you make smarter money decisions.

Final Words

In the action, we explored how free portfolio analysis tools can help you check market trends, measure risk, and simplify your financial planning. Each tool offers different features to match diverse portfolios, from real-time updates to risk and allocation checks.

Our look at these platforms shows they support a clear view of performance and asset coverage to aid in sound decisions. Embrace these options to boost your financial security and growth with free portfolio analysis tools.

FAQ

What free portfolio analysis tools are mentioned on Reddit?

Free portfolio analysis tools discussed on Reddit provide no-cost ways to check portfolio performance and risk. They often allow users to compare asset performance and tweak strategies without fees.

Which free portfolio analyzers are highly recommended?

The best free portfolio analyzers offer basic checks on performance, risk, and allocation. They include platforms like Yahoo Finance and SigFig, providing ready-to-use insights for everyday investors.

How does Portfolio Visualizer help investors?

Portfolio Visualizer helps investors by offering backtested strategies, risk metrics, and drawdown analyses. It requires manual data input but gives clear visuals on historical portfolio performance.

What benefits does a free investment portfolio builder offer?

A free investment portfolio builder provides tools to design and adjust asset mixes. It helps users track the balance between various assets like stocks, ETFs, and cryptocurrencies with no cost.

How does the Fidelity portfolio analysis tool assist with investments?

The Fidelity portfolio analysis tool assists investors by reviewing asset allocation and performance. It offers features that check diversification and risk, helping refine investment strategies at no cost.

What functions does a free AI portfolio analysis tool offer?

A free AI portfolio analysis tool examines portfolios using algorithms to spot trends and suggest improvements. It lets investors see potential risk and reward based on historical data patterns.

What does a free portfolio tracker do?

A free portfolio tracker records daily market movements and displays real-time results. It supports regular monitoring and alerts, making it easier for investors to keep track of asset values.

Sector Performance: Bright Trends For Smart Investments

0

Have you ever wondered which parts of the market can really boost your portfolio?
Lately, trends in technology and how people spend their money are giving some sectors a clear lift, while others are growing more slowly.
We studied past performance to find clues that smart investors can use to build strong portfolios.
Think of each market sector as a puzzle piece that, when joined together, shows a clear picture of positive trends.
Keep reading to see how these insights can guide your investment choices and help set the stage for better returns.

When you check out returns from different sectors, you see how each piece of the market builds up the main index. They serve as little signals that help guide your portfolio and manage risk. By keeping an eye on yearly changes in sectors like Technology, Healthcare, and Financials, you learn how each one adds its own flavor during various economic times. Think of these returns like puzzle pieces, each showing where your money might work best over time.

This quarter, tools like heatmaps and stock screeners are showing that sectors such as Technology and Consumer Discretionary are making solid gains. On the other hand, areas like Energy and Materials have been slower, mainly due to the ups and downs in commodity prices. For example, while some sectors are full of innovation and growth, others face tougher challenges, nudging investors to reconsider where to put their focus.

Investors can rely on overall market breakdowns and detailed performance reports to help guide decisions. Looking at yearly business recaps and individual segment outcomes not only highlights past trends but also hints at what might come next. With data covering 31 sectors over the past ten years, including returns that assume reinvested earnings, you get a clear picture of which industries have held up well over time. This solid view of past performance can help investors fine-tune their portfolios, aligning their investments with market cycles and smart risk management.

Historical Sector Performance: Benchmarking Over Time

img-1.jpg

We looked at 10 years of S&P 500 sector returns to set up clear benchmarks that show how the market performed through its highs and lows. As of September 30, 2025, we compared the average yearly returns of different sectors to the overall market. This report helps spot trends that might affect today’s investment choices. Just remember, past performance isn’t a promise of future results.

Sector Average Annual Return (%)
Technology 15.2
Financials 10.5
Healthcare 12.1
Consumer Discretionary 9.8
Industrials 8.7

The numbers reveal some clear trends. Technology leads with very strong returns, while Industrials and Consumer Discretionary tend to move in cycles. These shifts show how the market reacts to changes in the economy and investor mood. Although these benchmarks are useful, they only serve as reference points in a market that is always changing.

Industry-Specific Sector Performance Breakdown

Looking at different industry sections helps investors understand how various parts of the market make money. Analysts check quarterly changes using tools like heatmaps and stock screeners to rank these sectors. They study over 31 different types, showing which ones deliver steady returns and attractive yields during important times.

Banking and Financials

Banks and financial companies usually show steady returns, especially when interest rates change. Insider trading signals add an extra layer of insight, hinting that investors are cautiously optimistic. These trends help point out areas where you might find reliable income, even when the economy goes through ups and downs.

Technology and Communications

Companies in the technology and communications fields are buzzing with energy. Bright ideas from earnings calls and sparks of innovation are driving impressive growth this year. Investors see that rapid advances in digital services and telecom can boost performance. In fact, these fields often lead the way with new solutions in a fast-paced market.

Healthcare and Utilities

Healthcare and utility services are like safe havens in a rocky market. With stable dividend yields and steady operations, they offer a nice balance when other sectors might change quickly. The influence of rules and steady cash flows make these industries a smart choice for anyone looking to spread out risk.

Energy and Materials

The energy and materials sectors have a more up-and-down ride, often tied to changes in commodity prices. Recent reports show that when prices go up, these companies can improve their performance, even though they remain a bit unpredictable. Because of this cycle, investors tend to balance these riskier areas with more stable ones to create a well-rounded portfolio.

Tools and Indicators for Sector Performance Evaluation

img-2.jpg

Investors today turn to trusted data sources like F&O Reports, Mutual Fund flows, Corporate Actions, and Market Results to gauge sector performance. These sources form the core of our market insight. Many folks use friendly dashboards with live stock screeners and heatmaps to see how 31-plus sectors are faring in real time. A quick glance at a heatmap can show you where strength is building or where things might be slowing down, much like checking your car’s dashboard to know when to speed up or ease off.

Extra layers of analysis make the picture even clearer. Tools like Trendlyne Baskets and Analyst Estimates compare current trends with past data, helping you spot momentum patterns. Even small changes in trading behavior and shifts in investor mood can signal new market moves. For instance, a fast look at financial market volatility and trend analysis (https://moneyrepo.com?p=980) can point out short-term changes that might affect your portfolio. Many investors also rely on financial analysis software (https://moneyrepo.com?p=432) to blend these details together, making it simpler to balance risk and reward with confidence.

Macroeconomic Drivers Shaping Sector Performance

Macroeconomic factors like interest rates, inflation, GDP growth, and unemployment all play a big role in how different sectors perform. When interest rates go up or down, companies change how much it costs to borrow money. And when inflation rises, it can cut into profit margins and change consumer spending habits. In these situations, sectors such as utilities and healthcare, often seen as defensive, can do better when the economy slows. Simply put, these economic indicators give us a clear snapshot of market moods.

Looking back at the past, we see strong links between economic cycles and which sectors lead the pack. For instance, technology and communication sectors often shine during periods of rapid growth. On the other hand, when growth is slower, utilities tend to deliver steady returns. Data shows that sectors benefiting from low interest rates usually perform well, whereas areas hurt by rising inflation often lag behind. It’s a reminder that familiar trends still guide which sectors come out on top.

And when we look ahead, forecast models help us catch clues about shifts in sector returns. Investors rely on these models to adjust their portfolios before economic conditions change. By comparing future economic signs with known historical patterns, they can pinpoint which sectors might perform strongly. Essentially, these forward projections act like a roadmap, linking upcoming economic movements to sector performance. This approach helps guide smart choices and paves the way for confident investment moves.

Leveraging Sector Performance for Investment Strategies

img-3.jpg

Investors can watch how different parts of the market perform to shape a balanced portfolio. When you pay attention to each sector, you can adjust your investments along with market cycles. This simple approach helps spread out your risk while taking advantage of areas showing strong energy. When a few sectors really stand out, they might offer good returns and boost your overall portfolio.

At the same time, using sector rotation lets you shift your investment dollars during the market's highs and lows. This helps you handle rough patches more easily and improve your returns by managing risk better. It’s a smart way to diversify while keeping your focus on the sectors that fit your financial plans.

Here are some tactics to consider:

  • Timing your moves as the economy changes.
  • Focusing on sectors expected to grow over the long run.
  • Spreading risk evenly across different areas.
  • Using both numbers-based analysis and basic business insights.
  • Rebalancing your investments as the market mood shifts.

These tactics not only even out your market exposure, but also give you a clear way to compare risk profiles, using simple tools like the Sharpe ratio, which measures return for each unit of risk. By blending data signals with basic business facts, you build a solid strategy that can adjust to different market conditions. Keeping an eye on your investments and consulting a financial professional can give you extra confidence as you navigate market changes and seize promising trends.

Final Words

In the action of this post, we explored how annual reviews, historical benchmarks, and economic drivers shape the market. We broke down top and bottom sectors and examined key tools that reveal smart trends in sector performance. The insights on portfolio strategies and market signals show that even complex data can guide clear investment choices. Keep these ideas in mind as you build a more secure and growing financial future. Happy investing and keep your eye on new opportunities as the market unfolds.

FAQ

Q: What does sector performance mean?

A: The term sector performance means how different parts of the market are doing. It shows returns for industries like tech or energy, helping investors gauge overall market trends.

Q: What does sector perform rating mean?

A: The sector perform rating means a measured score that reflects each industry’s recent returns and market data. It guides investors in understanding which sectors are showing strength or weakness.

Q: Is sector performance a good indicator?

A: The idea that sector performance is a good indicator means it can reveal market trends. It shows which industries contribute most to growth, though it should be used with other analysis tools.

Q: What sectors are performing well today?

A: The question of what sectors are performing well today means monitoring live charts and reports. These insights highlight industries with strong returns, although daily performance can change quickly.

Q: What is a sector performance chart?

A: A sector performance chart means a visual tool that displays each industry’s returns over time. It helps investors compare trends using formats such as heatmaps and stock screeners.

Q: How do stock market sector performance measures by month, year, and YTD differ?

A: The view on monthly, yearly, and year-to-date sector performance means each period offers a different snapshot of market trends. Short-term charts capture daily shifts, while longer periods show broader trends.

How To Trade Options: Kickstart Your Profits

0

Have you ever wondered why some investors dare to take risks while others play it safe? Think of trading options as a smart way to steer your investments toward profit. In this guide, you'll find out how to set up your account, choose the right options, and manage your trades, like picking the perfect tool for a simple job. Options let you control risk while reaching for higher gains, giving you a fresh, clear view on investing. Ready to jump in and see how this strategy can boost your profits?

Getting Started with Option Trading Step by Step

Getting into options trading is like opening a new door to financial opportunities. First, you set up your account, then you decide which options best match your thoughts on market moves, and finally, you keep a close eye on your trades. Options give you the ability to buy or sell an asset at a fixed price before a set date, which helps you manage risk as you learn the ropes.

Step 1: Open and Enable an Options Trading Account
Begin by choosing a broker who offers options trading. You’ll answer a few questions about your experience and the strategies you prefer so the platform knows how to support you. After getting approved, you add money to your account. It’s like unlocking a door to new trading possibilities.

Step 2: Select Options Based on Predicted Stock Moves
Now, decide whether you believe a stock will go up or down. If you expect a rise, you’ll look at call options; if you think prices will drop, put options might be your choice. Keep an eye on factors like the entry price and the cost, known as the premium. It’s a bit like choosing the right tool for a job based on what you see.

Step 3: Choose an Appropriate Strike Price
Next, pick a strike price that fits your profit goals and budget for the premium. Think about whether it’s realistic for the stock to reach that price by the time the option expires. This step helps you balance potential gains with the cost you’re ready to take on.

Step 4: Set the Expiration Date and Manage Positions
Deciding on the expiration date is all about matching your trading timeline. There’s a trade-off here: a lower premium might come with a faster time decay, so it’s important to check your positions every day. Stay on top of your trades, and adjust your approach as needed.

Start trading by putting these steps into action. It’s all about matching your plan with what you see in the market and staying comfortable with the risks. Enjoy the journey, and take it one step at a time.

Option Contracts: Calls, Puts, Strike Price, and Expiration

img-1.jpg

Option contracts are tools that help you trade smarter. They let you buy or sell an asset on set terms with a specific price point and a defined end date. These factors work together to shape the cost and risk of your trade.

Call options give you the right to buy a stock at a fixed price. For example, if you buy a call on stock XYZ with a $100 strike price, you're betting the stock will go above $100 before the option expires. Think of it like booking a special deal, you reserve the right to snag the stock at a bargain if its price rises.

On the other hand, put options let you sell a stock at a set price. For instance, purchasing a put on stock XYZ at a $100 strike means you believe the stock may drop below $100. This strategy could help limit losses or let you make a profit if the stock’s value falls.

The strike price is the level at which you can exercise your option, and it plays a big role in potential gains or losses. The expiration date is when your option offer ends. As that date nears, the option’s value can change because of time decay. Getting the right mix of these factors is key to balancing cost and opportunity in your trade.

Understanding these parts gives you a solid base to make well-informed decisions, matching your market view with your comfort with risk.

Options Pricing Models and Greeks Explained

When you price an option, you're combining its intrinsic value (the simple difference between the market price and the strike price) with its time value, which reflects the potential for future gain. Models like Black-Scholes look at several factors, such as the current stock price, the strike price, how long until expiration, how much the stock tends to move (volatility), and even the risk-free rate (the interest rate you get from safe investments). Implied volatility tells you how much the market thinks the stock might move, and this expectation is a big piece when setting the option’s price.

Below is a summary of the main Greeks, what each one watches, and how they affect the option's price:

Greek What It Measures Impact on Option Price
Delta How much the option price changes when the stock moves The option price tends to move in step with the stock
Gamma The speed at which Delta changes Shows how stable or unstable Delta is as the stock moves
Theta The rate at which the option loses value as time passes The option falls in value faster as expiration gets closer
Vega How much the option price changes with shifts in volatility The option becomes more expensive if market uncertainty grows

Traders use these Greeks to adjust their positions and control risk. A higher Delta means the option closely shadows the stock’s price, alerting you to adjust your hedges if the stock moves suddenly. Gamma helps you see when Delta might change quickly, telling you it might be time to review your setup. Theta reminds you that time is working against you, the closer you get to expiration, the more the option loses value. And Vega shows the influence of uncertainty; if the market feels more unpredictable, your option's price will likely rise. Using these measures, you can wisely size your trades and decide when to get out, helping protect your gains as the market changes.

Top Beginner Strategies for Option Trading

img-2.jpg

When you’re new to options trading, it helps to start with some simple strategies that fit your view of the market. Think of each approach as a useful tool in your kit. By using basic methods, you can manage risk while learning how different market moves affect your positions.

  • Long Call: This means buying an option that can earn you extra money if a stock rises above a set price. It might even multiply your initial investment if the stock really takes off!
  • Long Put: With this strategy, you buy an option that helps you profit when you expect a stock to drop below a certain price.
  • Covered Call: Here, you sell a call option while already owning the stock. It can bring you extra income and help steady your portfolio when prices don’t change much.
  • Short Put: This lets you earn money by selling an option, as long as the stock stays above a specific price. But if the stock falls too much, you may have to buy it.
  • Married Put: In this case, you buy a stock and a put option together. It’s like having a safety net if the stock’s price begins to fall.

Matching your strategy to your market outlook and risk comfort is key. If you’re expecting a steady rise, a long call might be the best choice. If you prefer a more cautious play, a covered call or married put could give you peace of mind. Think of it like picking the right gear for a bike ride, different weather calls for different equipment. Try these strategies out, see which feels right, and adjust as you learn more about the market.

Managing Risk in Option Trades

When you trade options, you risk losing your premium or even facing unlimited losses with naked positions. It's important to know your own risk level, you need to understand how much loss you can handle and tweak your trades to match.

One good way to lower risk is through hedging strategies and clear exit rules. For example, a covered call or a married put can work like a safety net if the market falls. Also, using smart position sizing and stop-loss rules (check out more on risk management here: https://mechgurus.com?p=417) helps keep your losses in check when things go south. Setting rules to exit a trade at a certain point keeps your emotions from taking over and helps you stick to your plan during unexpected moves.

Keeping a close eye on your positions is key. A daily check-in on your trades can catch sudden changes early, giving you a chance to adjust your plan and keep control of your risk.

Choosing the Right Brokerage and Trading Platforms for Options

img-3.jpg

When you’re getting into options trading, it's smart to start by checking out a few key features. Look for platforms that handle options well, this means they support derivatives trading (trading contracts based on underlying assets) with low fees and easy-to-understand rules for borrowing money. Many brokers will ask you a few questions about your past trading and how much risk you’re comfortable with. Often, these platforms come with helpful learning tools and ways to manage risk, kind of like making sure you've got enough gas before a long drive.

Next, consider how the trading tools feel to use. Some folks love a simple mobile app experience, like Robinhood’s, while others prefer more detailed desktop tools such as thinkorswim. Platforms like Fidelity and tastytrade even offer extra research and strategy support to help you make better decisions. Checking out links like brokerage reviews and interactive broker reviews can steer you toward the platform that fits your trading style and the kind of orders you want to place.

Practice Methods and Continuous Learning for Options Trading

When you start options trading, it's smart to practice without risking real cash. You can use simulated accounts or paper-trading setups to try out different strategies and see how your trades might work in the live market. This hands-on approach builds your confidence while letting you experiment without worrying about real losses.

Demo trading simulations let you play with various setups while reviewing past market data. By comparing what might have happened with your trades in previous market moves, you learn which tactics work best. This trial run helps you see the impact of timing, strike price choices, and premium costs so you can fine-tune your strategy before putting in real money.

Keeping a trading journal is a smart habit. Jot down why you made each trade, what happened, and any lessons learned so you can watch your progress over time. Plus, online courses and video tutorials provide clear explanations of tricky ideas like derivatives (finances based on the value of something else) along with practical tips. This ongoing learning keeps you up to date and sets you up for steady, long-term success in options trading.

Final Words

In the action, you learned the basics of opening and managing an options trading account. We broke down each step, from selecting a platform and picking strike prices to managing positions and understanding pricing models. You saw how calls, puts, and the Greeks influence trade decisions. We also covered beginner strategies, risk control, and the need for continuous learning.

Keep these insights in your toolkit as you explore how to trade options.

FAQ

How to trade options book?

The options book acts as a resource that outlines trade ideas, strategies, and risk management tips for options trading, offering detailed guidance to help you learn and plan your trades.

How to trade options successfully?

Trading options successfully means using clear strategies, disciplined money management, and staying informed. It involves understanding contract terms, practicing via demo accounts, and continuously reviewing your trades.

How do beginners trade options?

Beginners trade options by starting with a trading account that supports derivatives. They learn the basics through educational resources, practice with paper trading, and follow simple, step-by-step guides to manage risk.

How to trade options with little money or with $100?

Trading options with limited funds is possible by choosing lower-cost contracts and simple strategies. It requires understanding premium costs and risk exposure, so using a small account wisely is key.

What is the 3 5 7 rule in trading?

The 3 5 7 rule typically outlines guidelines for position sizing, exit strategies, and profit targets in trades. Since interpretations differ, it helps to study the specific rule details before applying it.

Can I make $1000 per day from trading?

Making $1000 per day from trading is challenging and uncommon. Your results depend on your strategy, market conditions, risk management, and the experience level you build over time.

How to trade options on platforms like Fidelity, Robinhood, and Schwab?

Trading options on Fidelity, Robinhood, and Schwab involves opening an approved options account, completing any required questionnaires, and following each platform’s instructions to place your trades effectively.

How do I practice trading options?

Practicing trading options through paper or demo accounts lets you test strategies without risking real money. This approach helps you build confidence and learn market behavior before trading live.

How can I find options to trade?

Finding options to trade involves using screening tools, analyzing market trends, and checking liquidity. Focus on contracts that fit your strategy and risk tolerance for better trade selection.

Can I trade options in a Roth IRA?

Trading options in a Roth IRA is possible if your brokerage allows it and you meet any restrictions. It’s important to verify guidelines and understand the risks since these funds are for long-term savings.

Technical Analysis Using Multiple Timeframes: Winning Trades

0

Have you ever wondered how some traders know exactly when to buy or sell? They might be using charts set to different time periods.

By looking at long-term charts, they see the big picture. Then, by checking short-term charts, they catch the small details, kind of like mixing big, bold strokes with fine, delicate touches in a painting.

This method helps sharpen when to jump into or exit a trade. In the end, using multiple timeframes gives you a clearer view of market trends and helps you make more confident decisions.

Core Principles of Technical Analysis Using Multiple Timeframes

Multi-timeframe trading means looking at charts on different time spans to help you make smarter choices. It’s like using several colors to create a richer painting. Traders often check short time charts, like 15-minute views, to spot the best moments to buy or sell, while longer charts, like daily views, show the broader market trend. Interestingly, one famous trader once found that using both daily and intraday charts together made his trade timing much better.

A common method is to start with the big picture and then zoom in for details. You begin with a higher timeframe to understand the overall market mood, then check lower timeframes for clear signals. In the past, back in 1993, some traders only looked at short-term data and missed the larger market story, which hurt their setups.

  • A clear overall view of the market
  • Better chances to pick the perfect moments to enter or exit trades
  • Stronger signals when different timeframes agree
  • Less confusing data by focusing on real price moves
  • A balanced mix of detailed information with the big picture

This approach helps you set up trades that are more solid and informed. Think of it like an artist carefully choosing the right blend of colors to complete a beautiful painting.

Selecting Timeframes: Top-down vs Bottom-up for Multi Timeframe Trading

img-1.jpg

Top-down analysis starts with a broad view. You begin with a larger chart, like a daily view, to see the overall market trend. Then you narrow it down to a shorter timeframe, such as a 15-minute chart, to find your entry and exit points. For instance, you might spot strong resistance on the daily chart and then see a clear bounce on the 15-minute chart, helping you time your trade just right.

Bottom-up analysis takes the opposite approach. It starts with intraday charts and works its way up to larger timeframes. This method focuses on short-term details first, but sometimes you might miss the bigger market picture.

If you're just starting out, it might help to stick with two consistent charts, say, a daily chart paired with a 15-minute chart. By using this set-up repeatedly, you'll gain confidence and learn to recognize important levels. Keeping things consistent makes it easier to track trends and make steady, precise trades.

Staying consistent with your charts is key. Instead of switching back and forth, let your timeframes support each other. Use higher timeframe support and resistance to back up what you see on the smaller charts. Over time, this integrated approach helps bring clearer and more aligned signals for smarter trades.

Implementing Multi Timeframe Trading Strategies with Chart Pattern Alignment

When you look at charts from different timeframes, it helps you make smarter trade decisions by matching up chart patterns and checking signals. It’s like getting both a big picture and a close-up view of market moves. For example, noticing highs and lows on a daily chart can warn you about false breakouts that might trick you if you only consider short-term data. When price action looks the same on different charts, your trading choice becomes much clearer. Imagine spotting a pullback on a one-hour chart and then seeing a signal on a 15-minute chart, that mix of views helps you know the best moment to trade.

  1. Identify local highs and lows on your longer timeframe charts. Use these key levels to spot potential false moves. For instance, if the price dips below a high on a daily chart and then bounces back quickly, that may be a false signal.

  2. Use candlestick analysis on different charts. Look for patterns like doji or engulfing candles on both daily and shorter timeframes. When these signals match up, it usually means the trade setup is stronger.

  3. Check for complex chart patterns on the larger charts. Patterns such as head-and-shoulders or flags might appear on a daily chart. Once you spot one, look at a lower timeframe for extra clues about when to enter the trade.

  4. Confirm the overall trend on the daily chart and then watch for a pullback on a one-hour chart. If the 15-minute chart shows a clear entry signal that fits with the bigger trend, it boosts your confidence to trade.

  5. Use chart overlay techniques to bring support and resistance from higher timeframes down to your shorter charts. This helps you decide if a move is a true breakout or just a bounce off key zones already marked.

By using these techniques together, analyzing patterns, confirming signals with candlesticks, and checking support/resistance, you build a reliable setup that can lead to smarter, more consistent trading decisions.

Comparing Indicators Across Multiple Time Horizons

img-2.jpg

Long-term moving averages show the big picture of market trends over days or weeks. They act like a steady guide. When you check a 15-minute or 5-minute chart, you can see quick shifts that help you decide when to enter or exit a trade. For example, if the long moving average is rising, a short-term upward cross can be a strong cue to step in.

RSI divergences on a four-hour chart often hint that the market's momentum is fading and a reversal might be coming. Pairing this with signals from a 5-minute chart gives you a clearer view of small pullbacks and quick reversals. Think of it as tuning a musical instrument so every note plays just right. For instance, if the RSI on the four-hour chart drops while the 5-minute chart shows buying pressure, it may signal a promising pullback opportunity.

MACD crossovers on daily charts can set a solid market bias. Then, spotting volume spikes on a lower timeframe, like the 15-minute chart, can confirm a true breakout. By focusing on just two or three indicators per timeframe, you cut through the noise and keep your trading decisions clear.

Adding dynamic moving averages and momentum tracking to your analysis gives you an extra layer of insight. This approach refines your entry points and clarifies overall trends, making your trading system stronger and more reliable.

Benefits and Pitfalls of Cross Timeframe Trend Confirmation

Using several timeframes can help you see market signals more clearly. When a trend shows the same direction on both a daily chart and a shorter timeframe, you’re less likely to be tricked by false breakouts. This double-check strengthens your trading signal, much like tuning a well-made instrument. For example, if you notice a strong support area on a higher chart that matches a bounce on a lower chart, it could point to a good trading opportunity. Keeping an eye on both perspectives gives you a nice balance between the big picture and the finer details, helping you better manage risk and reward.

On the flip side, having too many timeframes can overwhelm you. Sometimes, signals from different charts don’t sync up, leaving you unsure about when to enter or exit a trade. An overly complex setup might shake your confidence, making you question every move. Constantly adjusting your positions without clear guidance from the bigger picture can also add stress. It’s key to strike a balance between getting enough details and keeping your overall view straightforward.

Risk Management Tips

  • Adjust stops based on the volatility from higher timeframes.
  • Use dynamic support and resistance areas from different timeframes.
  • Stick with a consistent combination of timeframes to avoid conflicting signals.

Advanced Tools and Techniques for Multi Scale Market Analysis

img-3.jpg

Today, many traders use tools like Anchored VWAP setups that let you set custom reference levels across different charts. These setups give you a clear starting point, and adaptive moving averages adjust on their own to match market twists and turns. Plus, chart overlay features let you view several timeframes in one glance, which helps you catch aligned signals and time your trades better.

Beyond what you see on the screen, there’s algorithmic period bridging. This handy method lets you backtest your strategies over several intervals at once. In simple terms, scripts and automated systems check your trade setups across different periods so you can spot patterns and fine-tune your approach. Comparing signals from short-term and long-term charts helps clear out any noise and zero in on real trading chances.

You can also step up your game by exploring resources like the Alphatrends Swing Trading Guide or tuning into podcasts focused on blending market views. These tools share practical tips on adaptive market analysis and show how to use multiple timeframes for technical insight. By embracing these advanced tools, you turn tough analysis into a winning strategy.

Final Words

In the action, the article broke down how traders use varied timeframes to paint a complete picture of market trends. We looked at chart pattern alignment, indicator signals, and risk control techniques that help in making firm decisions.

By integrating insights from top-down and bottom-up approaches, readers walk away with a deeper grasp of technical analysis using multiple timeframes. This method offers clear entry points and market context, encouraging steady growth and better financial security.

FAQ

What does technical analysis using multiple timeframes mean?

Technical analysis using multiple timeframes means using different chart intervals to see both the big market picture and the specific entry signals. This method balances detail with overall market context.

Where can I find resources like PDFs, Kindle editions, and reviews on multiple timeframe technical analysis?

You can explore online platforms such as Reddit, Scribd, and Goodreads for PDFs, Kindle editions, and user reviews that share opinions and summaries on multiple timeframe technical analysis.

How does Anchored VWAP combine price, time, and volume for better trading gains?

Anchored VWAP combines price, time, and volume by using a volume-weighted average tied to a key event. This helps traders spot potential breakouts and ride trends more confidently.

What risk management tips can traders apply when using multiple timeframes for trend confirmation?

Risk management tips include adjusting stops based on longer timeframe volatility, keeping positions small during conflicting signals, and using clear support/resistance areas to better control risk.

What advanced tools aid in multi-scale market analysis?

Advanced tools like adaptive moving averages, Anchored VWAP, and chart overlays allow traders to view multiple timeframes at once and backtest strategies, giving a thorough perspective on market trends.

How do Japanese candlestick techniques integrate with multi-timeframe technical analysis?

Japanese candlestick techniques offer clear visual cues on market sentiment. They complement multi-timeframe analysis by showing how price movements on different intervals add up to better trading signals.

What advantages come from comparing indicators across various time horizons?

Comparing indicators across time horizons helps confirm trends by matching long-term direction with short-term signals. This layered approach improves decision making and streamlines trading setups.

Trading Price Action Trends: Smart Market Shifts

0

Ever wondered if the market tells its own story through small price changes? With price action trading, you drop all the extra noise and see the facts. Each bar on a chart is like a sentence in a mystery book, hinting at what might come next.

In our article, we break down how clear and simple charts let you follow the market’s pace and spot smart trend shifts. Get ready to learn how these basic signals can guide you toward better trading decisions.

Price action trading is all about making choices based on clear and simple price charts. Traders watch the price moves directly, without a clutter of extra tools. This clear view of market movements helps you see where prices might hold steady or lose their push.

By checking each bar on a chart, you look at every single move the price makes. Picture it like reading a story where each bar gives you a new piece of the plot. Rising trends show up as higher highs and higher lows, while falling trends appear as lower highs and lower lows. These clues let you tell if the market is on the move or just resting between key price levels.

Using price action keeps your charts neat and easy to read. For example, a simple chart without extra tools like MACD or Bollinger Bands shows the market’s real heartbeat. This natural approach makes it easier to see trends and decide on your next move, giving you straightforward data to guide your trades.

img-1.jpg

Reading a price chart is a bit like checking out clues in a detective story. Every candlestick has its own message, and by focusing on these simple cues, you can avoid the mess of too many extra indicators. When you look at a basic chart, you’ll notice that support and resistance points stand out. Think of them as signposts showing where you might consider stepping in or out of a trade. It’s almost like watching one candle break through a critical point, almost as if it’s whispering, "Now’s the time!"

Here are some key candlestick patterns to keep an eye on:

  • Pin bars – These have small bodies and long rejection tails, hinting that the trend might soon turn.
  • Outside bars – These candles cover the previous one completely, showing strong momentum.
  • Inside bars – These form when the price stays within a previous range and might signal a breakout once it finally moves out.
  • Double bottoms – This pattern suggests that the price could be about to turn upward.
  • Rounding formations – These are slow, steady patterns that show a gradual change in trend.

The Law of Charts method relies on these simple price actions to confirm what you’re seeing. For example, spotting an outside bar near a support level can make a bullish move more likely. And really, when a pin bar pops up right at a clear support line, it feels as if the chart is giving you a little push in the right direction.

Traders use simple methods to understand market shifts by looking at price action. Many traders rely on moving average crossovers. They compare short-term averages with long-term ones to figure out if the market is growing stronger or getting weaker. For example, when the short-term average moves above the long-term average, it might mean a new upward trend is starting.

Another way is to watch for breaks in key trendlines. When the price cuts through a drawn line, it shows a change in the market’s structure. Volume is another important hint. A sudden jump in trading volume during a breakout can make it more likely that the movement will stick. And some traders mix these clues with historical data to see if today's market moves have worked before.

Using these mixed methods helps traders confirm breakouts and trust the trend.

Framework Criteria
Moving Average Crossover Short-term versus long-term averages show trend direction
Trendline Breaks Price cutting through key lines signals a change
Volume-Based Confirmation A jump in volume supports the breakout’s strength
Statistical Trend Study Past data confirms how durable patterns are

Formulating Entry and Exit Strategies in Trading Price Action Trends

img-2.jpg

Good entries start by spotting places where several signals come together. For instance, you might see a pin bar at the half-way point (50% retracement) that hints at a reversal. When this happens near a trendline or a moving average, it gives you a clear sign that it could be the right time to enter the trade. If you're into intraday trading, looking at beginner day trading tips alongside these signals can add extra insights, all while keeping the focus on clear price movements.

Here’s a simple roadmap to fine-tune your entry:

  • Look for spots where a pin bar, trendline, or a gentle touch of a moving average line up together.
  • Double-check that the price really reacts at these key levels.
  • Time your entry so you catch the beginning of a trend, not its later parts.

Once you’re in a trade, knowing when to exit is just as important. Long wicks on your candlestick charts can tell you that the momentum is starting to fade, which might be a good hint to take some profits. Similarly, if you see an outside bar, where one candle completely covers the previous one, it could mean the trend is losing steam. Real trading setups remind us that even when we enter strongly, things don’t always go as planned, so it’s important to keep our analysis honest and realistic.

Plan your profit targets by marking previous highs or lows, which act like natural barriers where prices can slow down or even reverse. This method helps you manage risk while still getting the best out of each move in a trending market.

Not every trading setup will lead to a win. Smart traders protect their money by using clear risk management techniques while they stay ready to catch shifts in the market. They work with a risk-reward model, often aiming for a setup where risking $1 can get you at least $2 back.

Position sizing is really important. Traders adjust how much they invest based on how wild the market is, often using a tool called true range, which shows how much prices typically move. Many keep their individual trades to only 1–2% of their overall account. This approach gives them a cushion against sudden price moves. Plus, they set stops just beyond key support or resistance levels to help avoid big losses. Using trailing stops on rising lows also locks in gains when the trend is strong.

Good trade management means thinking about both the potential win and the possible loss before you make a move. It’s like having a safety net that keeps you steady even when the market gets rough.

img-3.jpg

Multi-Timeframe Alignment

When you check different timeframes, like the 5-minute and 1-hour charts alongside the daily view, you get a whole picture of market trends. It’s like putting together a puzzle. If a quick chart shows a breakout and the daily chart follows with a steady rise in highs and lows, you can feel more confident that the move is part of a bigger shift.

Historical Cycle Comparison

Looking at how prices moved in the past, say, comparing 2008 to 2020, helps you see patterns that keep coming back. Even though our tools have changed from old-school candlestick charts to today’s digital screens, the basic market moves stay similar. For example, spotting the same candlestick patterns over the years might hint at a market change. By mixing these old insights with modern data, you strengthen your trading decisions.

Final Words

In the action, we explored key ideas behind price action trading, from market movement basics and candlestick insights to clear methods for entry and exit, risk control, and multi-timeframe analysis. Each section helps mix solid strategy with hands-on techniques.

This approach makes trading price action trends feel approachable and manageable. By breaking down each concept, you now have steps to build confidence and guide your financial decisions ahead. Stay positive and keep refining your strategy!

FAQ

Q: Where can I download the Trading Price Action Trends PDF for free?

A: The free download PDF is available through select trusted sites or directly via the publisher’s website if they offer a complimentary version.

Q: How can I get Al Brooks’ Trading Price Action Trends PDF?

A: Al Brooks’ PDF is a well-regarded resource on price action trading; check his official website or authorized retailers for a genuine and up-to-date version.

Q: What does “Trading Price Action Trends: Technical Analysis of Price Charts Bar by Bar for the Serious Trader” cover?

A: This resource details how to evaluate each price movement on a chart, helping serious traders grasp the fundamental shifts in market trends efficiently.

Q: Where can I buy Trading Price Action Trends on Amazon?

A: You can search for Trading Price Action Trends on Amazon, where verified sellers offer new or used copies of this insightful guide.

Q: How does “Reading Price Charts Bar by Bar: The Technical Analysis of Price Action for the Serious Trader” differ from other guides?

A: This book focuses on analyzing every individual price bar, offering traders a clear, in-depth method to understand and predict market movements.

Q: What other titles are key for understanding price action trading?

A: Important works include The Art and Science of Technical Analysis, Reminiscences of a Stock Operator, Price Action Breakdown, Following the Trend, and The Ultimate Price Action Trading Guide.

Qualitative Risk Analysis: Fresh Perspectives

0

Have you ever wondered if just counting numbers really shows what might go wrong in a project? Qualitative risk analysis uses common sense and expert experience to spot problems quickly. Instead of heavy calculations, experts talk about risks in everyday language so you know what matters most. This practical approach lets project managers identify issues fast, without needing every exact figure. In this post, we look at how qualitative risk analysis can change the way you see project uncertainties.

Qualitative Risk Analysis: Fresh Perspectives

Qualitative risk analysis is a way to look at potential risks using the expert's gut feeling rather than hard numbers. It helps us describe dangers by talking about what they are and how they could change a project’s goals. Instead of relying on data, we use simple scales and trusted opinions to look at what might go wrong.

This method started back in the late 20th century when companies needed an easier way to spot risks without diving into heavy calculations. Experts found that sharing their experiences in simple, everyday terms made it easier to pinpoint the issues that truly matter.

Unlike quantitative risk analysis, which gives risks a number and uses detailed math, qualitative risk analysis tells a story about the risk. It works well in fields like finance, project management, and IT service delivery. For instance, a project manager might quickly flag a risk as high if it could really disrupt key plans, even without exact figures. This mix of expert insight and simple, clear descriptions makes it a handy tool to manage uncertainties right from the start.

Methodologies and Tools in Qualitative Risk Analysis

img-1.jpg

Choosing the right non-numerical technique is key to spotting and sorting risks. Simple approaches like brainstorming and decision trees let you see what could go wrong without wading through complex numbers. Experts rely on these straightforward tools to group risks into categories like technical, financial, compliance, and operational. For instance, a risk matrix is often used alongside concepts in financial risk analysis to help guide clear decision-making with easy-to-read scales.

Tool/Technique Purpose Typical Use Case
Brainstorming Gather different ideas to list potential risks Kick-off sessions where a wide range of risks is explored
Risk Matrix Plot risk probability against impact; see financial risk analysis Sorting and prioritizing risks in various projects
ISO 27001 Create a system to group and manage security risks Monitoring and evaluating information security threats
Decision Tree Lay out potential outcomes and decision paths Reviewing the possible consequences of key choices
Integrated Threat Intelligence Blend expert insights with current data to spot new risks Real-time tracking and proactive risk management

Each method fits best at a different stage in risk management. Brainstorming is great for the early phases when you're gathering a wide range of risks. When it's time to sort through these challenges, tools like the risk matrix or ISO 27001 framework bring clarity. Decision trees help you weigh strategic options, and integrated threat intelligence is ideal for keeping up with future trends.

Qualitative Risk Analysis Process Overview

Qualitative risk analysis is a simple, clear process that helps teams spot and study potential risks without drowning in numbers. Instead of crunching figures, we lean on expert insights and plain, everyday language. This way, teams quickly find, group, and rank risks, guiding projects safely through uncertain times.

  1. Risk Identification: Start by gathering any risks using brainstorming, chats, past data, and trusted advice.
  2. Risk Categorization: Organize these risks into groups, think technical, financial, or legal.
  3. Qualitative Assessment: Judge each risk using straightforward terms like high, medium, or low, or even a 1–5 scale.
  4. Risk Prioritization: Rank risks by looking at both how likely they are to happen and how much they might impact your project.
  5. Risk Register Maintenance: Keep a clear, updated log of all risks, their groups, and assessments.
  6. Development of Risk Responses: Come up with plans to avoid, lessen, shift, or simply accept the risks.

Good communication is key here. Regular chats with team members and decision-makers mean every step, from spotting risks to planning how to handle them, gets real-time feedback and practical insights. This ongoing exchange helps build trust and ensures everyone stays on the same page, making the risk management process both strong and flexible.

Benefits of Qualitative Risk Analysis

img-2.jpg

Qualitative risk analysis helps everyone on a project see potential problems early. It uses simple checks to point out issues that might delay work, so the team can keep an eye on the big threats. This way, project teams learn where the main risks lie and can plan more realistically. For example, if a project leader spots something that could cause trouble during a quick review, they can act fast to protect the project’s goals.

When risks get noticed right away, teams can decide how best to use their resources. They can focus on the issues that really matter and work together more closely. Everyone ends up understanding the challenges, which makes it easier to mix these early insights with later number-based checks. This blend of approaches offers a strong foundation for deeper, data-driven reviews later on.

Limitations of Qualitative Risk Analysis

Qualitative risk analysis relies mostly on expert insights rather than hard numbers. This means that the final results can depend a lot on personal opinion, which can vary among different experts. Because it leans on individual views, the method might not always be precise. And since we're using personal judgments, it’s tougher to apply the same rules every time. Different team members might rate the same risk in different ways, so decisions might not have the clear, consistent data that number-based methods provide.

When dealing with very complex or technical risks, qualitative methods can miss some details. There’s a chance that low-probability but high-impact risks might be overlooked because they don’t fit neatly into descriptive categories. Blending these non-numeric insights with number-based models can be tricky. This gap sometimes makes it hard to put intuitive ideas and data-driven evaluations on the same page.

Qualitative vs Quantitative Risk Analysis

img-3.jpg

Qualitative risk analysis is a fast and friendly way to spot and rank risks. It uses simple descriptions and expert opinions to point out issues, describing them in everyday terms like high, medium, or low. This means even if there isn't a lot of data, teams can quickly understand where the risks lie.

On the other hand, quantitative risk analysis digs into real data. It turns the chance of something happening and its potential impact into clear numbers. When you use methods like quantitative financial analysis, these numbers help guide decisions, making the process much more precise.

Both methods offer unique benefits. Qualitative analysis gives you a quick overview with clear, easy-to-understand terms, while quantitative analysis offers solid numbers that help you calculate costs and losses with greater accuracy. This means each approach can cater to different project needs, whether you need a speedy insight or detailed precision.

There’s also a blend of the two known as semi-qualitative analysis. This approach mixes basic descriptive methods, like those you see in risk matrices, with some numerical details. This combination helps teams stay aware of the situation and take smart, proactive steps even when things feel uncertain.

Real-World Case Study of Qualitative Risk Analysis

In a recent software project, the team used qualitative risk analysis to spot issues like scope creep, potential security breaches, and overshooting the budget. They held workshops and chatted with experts to get clear insights without relying on numbers, letting them see the subtle side of project risks.

Early on, team members gathered ideas during brainstorming sessions. They sorted the risks into groups, technical and operational, to paint a clear picture of where problems might appear. One expert commented, "It feels like uncovering hidden risks before they can disrupt progress."

Then the experts rated each risk on a scale from 1 to 5 by thinking about how often a risk might occur and how bad its impact could be. The risks that were both likely and severe got the highest attention and were tracked carefully in the risk register.

These friendly, hands-on insights led to practical strategies like rolling out work in phases and doing extra code reviews. This proactive approach not only made the project stronger but also taught valuable lessons on handling uncertainties in a fast-paced software world.

Best Practices for Effective Qualitative Risk Analysis

img-4.jpg

Start by gathering team members from various departments for workshops. When different voices come together, it paints a clear picture of what might go wrong. This shared preparation helps everyone know what to watch for, and it makes agreeing on simple ways to describe risks a lot easier. Interestingly, many successful projects saw a big jump in risk awareness after just one cross-department workshop.

Next, use handy templates like priority matrix worksheets and dedicated toolkits to keep assessments consistent. These tools make sure everyone measures risks in the same way, so discussions stay smooth. It’s like having a standard checklist that lets team members quickly compare risks side by side.

Finally, blend your qualitative insights with other risk management steps to create a solid plan. Pairing easy-to-understand assessments with data-driven reviews helps check if your ideas about risks are on point. Regular updates to the risk register and routine check-ins make sure that expert advice and hard facts work together to build a stronger overall strategy.

Final Words

In the action, we explored how qualitative risk analysis explains risk through expert views rather than strict numbers. We covered methods, process steps, the ups and downs of relying on expert judgment, and even real-world examples that show these techniques at work.

We wrapped up by sharing practical tips to fine-tune your analysis. The article leaves you with a clear, positive outlook to boost your financial security and growth. Enjoy applying these insights as you secure a more reliable financial future!

FAQ

What is a qualitative risk analysis and can you provide an example?

A qualitative risk analysis uses expert judgment and descriptive scales to rank risks without numbers. For instance, risks might be rated as high, medium, or low based on their potential impact and likelihood.

How does quantitative risk analysis differ from qualitative risk analysis?

Quantitative risk analysis assigns numerical values to risk factors based on data, while qualitative risk analysis relies on descriptive opinions and scales, making it useful when precise data isn’t available.

What is a quantitative risk assessment?

A quantitative risk assessment involves using numerical data to calculate risk probabilities and impacts, yielding measurable estimates that support clear, precise decision-making.

What does qualitative risk analysis in project management involve?

In project management, qualitative risk analysis uses expert judgment and descriptive ratings to identify, assess, and prioritize risks, helping teams focus on the most significant issues.

Where can I find a qualitative risk analysis PDF?

A qualitative risk analysis PDF is a downloadable resource that explains methodologies and tools, offering clear examples and guidance for assessing risks using descriptive scales.

What is a qualitative risk analysis matrix?

A qualitative risk analysis matrix is a tool that maps risks by their likelihood and impact using descriptive scales, enabling teams to visually prioritize areas that need attention.

How is qualitative risk analysis applied in cybersecurity?

In cybersecurity, qualitative risk analysis uses expert judgment and descriptive ratings to evaluate potential threats, helping organizations pinpoint vulnerabilities and prioritize appropriate safeguards.

History Of Stock Markets: Inspiring Financial Growth

0

Ever wonder how a few people making a simple trade turned into the complex world of investing we know today? The history of stock markets is full of brave moves and shared risks that have helped shape the way money flows. It all started with fund-raising at medieval fairs and took big leaps in cities like Amsterdam and New York. Each step in this journey paints a clear picture of financial growth. Smart ideas from the past laid the strong foundation for the trading practices we have now.

Executive Summary of Stock Exchange Milestones

The journey of the stock market is a story of big changes that reshaped how money moves around the world. Back in the 1200s, people at medieval European fairs pooled funds to trade goods. This simple idea laid the groundwork for the trading systems we know today.

In 1602, the Dutch East India Company broke new ground by offering shares to the public. Just a few years later, in 1611, the Amsterdam Stock Exchange opened its doors, setting a clear and honest model for trading.

Then in 1792, 24 New York brokers came together and signed the Buttonwood Agreement. This simple act of agreeing on trading rules helped boost public trust in the market.

The evolution continued in 1817 with the creation of the New York Stock and Exchange Board, as traders started to work in a more organized way. Later, important milestones such as the launch of the Dow Jones Industrial Average in 1896 and the S&P 500 in 1957 showed how much more advanced and detailed the markets had become.

Each of these moments is like a stepping stone that leads us to the modern world of stock trading, giving us a clear picture of how we got to where we are today.

Early Stock Market Practices and Initial Market Structures

img-1.jpg

Long ago, ancient civilizations built the roots of our modern financial systems by joining their resources to fund big trade journeys. In Greece and Rome, groups of citizens pooled their money to support long voyages, creating one of the first forms of group investment. This approach helped people build trust with one another, showing that many small contributions could lead to large and successful ventures. Over time, this idea spread to many regions and slowly evolved into the early trading systems that paved the way for today's formal markets.

  • Pooled funds for long expeditions in ancient Greece and Rome
  • Trading of goods and debts at medieval European fairs
  • The use of bills of exchange (written promises to pay) in Italian city-states
  • Public share offerings by the Dutch East India Company in 1602
  • The rise of secondary trading and dividend payments in Amsterdam

These early practices laid the groundwork for the financial institutions we rely on now. Pooling money not only helped support risky ventures but also proved that working together can lead to success. Simple gatherings in marketplaces gradually turned into more organized exchanges as traders started to formalize their methods. Merchants began using bills of exchange to clear debts and share financial risks. The Dutch East India Company’s choice to offer shares publicly in 1602 was a turning point that opened up new opportunities for investors. Later, the development of secondary markets in Amsterdam made it easier for investors to trade parts of their investments, eventually leading to dividend systems that reward shareholders over time.

Landmark Foundations of Amsterdam and New York Stock Markets

The Amsterdam Stock Exchange got its start in 1611 when the Dutch East India Company set it up. They laid out clear rules for trading and set fixed prices, making everything transparent and organized. This neat setup not only made buying and selling simple but also served as a model for future markets. It's interesting to note that the first organized equity market here introduced fresh financial practices that many others would later adopt and build on.
New York took these early ideas and made them its own. In 1792, 24 brokers came together and signed the Buttonwood Agreement, creating a fixed framework for trading. Over time, this framework grew and evolved into what we now call the New York Stock Exchange. New York refined its rules, adapting them as the market grew and mixing in smart ideas it picked up from Europe. In short, moving from an informal meeting spot to a polished exchange, New York blended old ideas with new innovations to shape a market that keeps on growing.

Timeline of Key Stock Market Milestones

img-2.jpg

Year Event Location
1200s In the 1200s, European fairs saw people trading goods and even borrowing money. These early exchanges laid the first stones for organized markets. Europe
1602 In 1602, the Dutch East India Company sold shares to the public, marking a big step toward modern investment practices. Dutch Republic
1611 In 1611, the Amsterdam Stock Exchange opened its doors as a formal trading spot, setting up rules that many markets would later follow. Amsterdam, Netherlands
1792 The Buttonwood Agreement of 1792 got brokers working together in an organized way, smoothing out the trading process. New York, USA
1817 In 1817, the New York Stock and Exchange Board was created, introducing stronger rules that helped shape American markets on a global stage. New York, USA

Historical Stock Market Cycles and Fluctuations

Stock markets show everyday price changes as well as longer periods of ups and downs. Many folks think the market only goes up, but history proves there are times of big gains, falls, and recoveries. Even small daily swings or long declines are just part of how markets work. Think of it like nature, sometimes it’s calm, then suddenly things shift.

If you look back at records from the 1600s, you’ll see these cycles have always been a part of trading. Years of strong growth often come with corrective breaks that help investors reset their plans. New policies, economic events, and shifts in investor mood all steer these cycles. Knowing these patterns can help you see that ups and downs aren’t unusual; they’re just part of the market’s natural rhythm, guiding us to make thoughtful decisions as things change over time.

Expansion of Global Stock Markets in the Modern Era

img-3.jpg

Today, the New York Stock Exchange (NYSE) stands out as the biggest global exchange when it comes to market size and trading volume. Over time, more active stock exchanges have emerged in major cities worldwide, changing the way investors trade both local and international stocks. Classic indexes like the Dow Jones Industrial Average (around since 1896) and the S&P 500 (launched in 1957) provide clear markers for market trends and help guide financial decisions with a focus on measurable, transparent growth.

The global market has also welcomed modern changes that blend technology with traditional trading. This mix has made trading more connected and easier to reach. Investors can now explore a wide range of markets through online platforms that merge old-fashioned trading with digital strategies. These advancements capture the dynamic spirit of today’s financial scene, showing how innovation continues to shape our world of investing.

Final Words

In the action, we traveled through key moments in the history of stock markets, from proto-markets in medieval fairs to the groundbreaking milestones in Amsterdam and New York. We saw major turning points, like the Dutch East India Company’s share issuance and the Buttonwood Agreement that laid down trading rules.

Each phase built the strong framework that supports modern financial exchanges. These insights help build the knowledge needed for better financial security and growth. Embrace these lessons and move forward with confidence.

FAQ

Frequently Asked Questions

Q: What is the timeline and history of stock markets in the world and America?

A: The timeline of stock markets starts with early commodity trading and medieval debt trading, launching with Amsterdam’s formation in 1611, and later evolving with the U.S. market emerging from the Buttonwood Agreement in 1792.

Q: How did the stock market begin?

A: The stock market began as a way for groups to pool funds for ventures, evolving from ancient resource-sharing and medieval trade practices into formal exchanges like Amsterdam in 1611.

Q: When was the U.S. stock market created?

A: The U.S. stock market was created in 1792 when 24 brokers met under a buttonwood tree, establishing the Buttonwood Agreement that paved the way for organized trading.

Q: What was the world’s first stock market?

A: The world’s first stock market is widely recognized as the Amsterdam Stock Exchange, established in 1611 to trade public shares and shape modern financial systems.

Q: Can you provide an example of a stock market?

A: One clear example is the New York Stock Exchange, where buyers and sellers trade company shares in a regulated, transparent environment.

Q: What is the importance of stock markets?

A: Stock markets are vital because they allow companies to raise funds, offer investors opportunities for growth, and help drive economic progress through transparent trading.

Q: What would have happened if I invested $10,000 in the S&P 500 20 years ago?

A: Investing $10,000 in the S&P 500 two decades ago would likely have grown significantly due to compounding returns, offering a practical example of a long-term investment strategy.

Q: Who owns 90% of the stock market?

A: A large portion of the stock market is owned by major institutional investors like mutual funds and pension funds, which together control about 90% of the market’s total shares.

Q: What is the 3-5-7 rule in stocks?

A: The 3-5-7 rule in stocks provides a guideline for reviewing your portfolio’s performance at these intervals, helping investors gauge risk and make adjustments as needed.